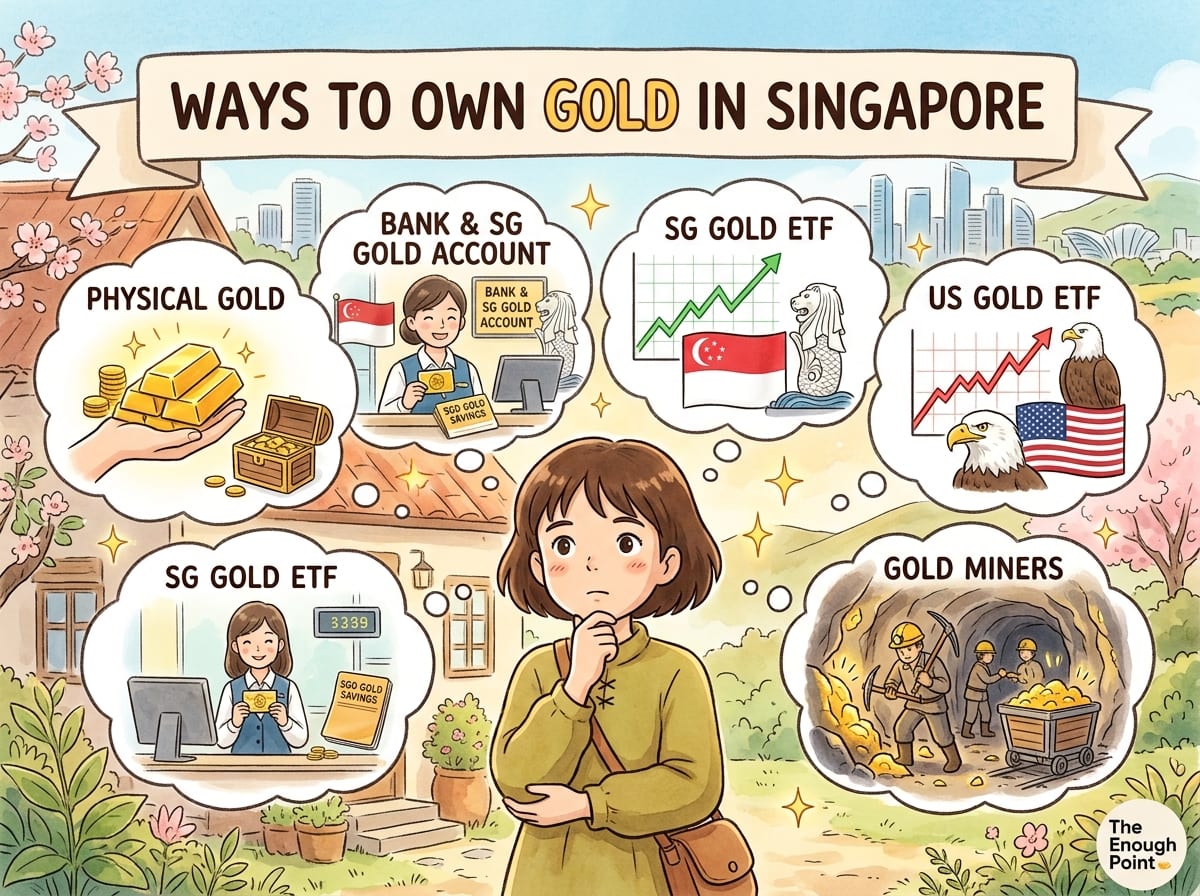
The question “should I own gold?” gets all the airtime. The question that actually costs people money is the one after it: which gold?
Singaporeans have been buying gold in size, and buying it through the exchange. By the end of June, the local listing of SPDR® Gold Shares was the largest ETF on the Singapore exchange — S$4.7 billion, past the Straits Times Index tracker — after S$981 million of inflows in six months (SGX, June 2026).
You have heard the buyers’ case. Governments are borrowing heavily. If growth and taxes do not cover the bills, the worry is that money creation will, eroding what a dollar buys. Central banks are quietly moving reserves into the one asset that is nobody’s liability.
The bears have their own exhibit, and it is twenty years long. From its January 1980 peak near US$850 an ounce, gold fell to about US$252 by August 1999 — roughly minus 70%, far worse after inflation — while bonds and shares compounded away from it. A generation of holding an asset that paid nothing, at a loss.
This piece argues neither case. Both records are real; which one the next decade resembles is precisely the thing nobody can verify in advance. What can be verified is everything else — what each way of owning gold actually is, what it costs, and which jobs it can and cannot do. That is this piece.
When gold has tended to earn its keep
There is a simpler question than “does gold go up”, and for anyone building a plan it is the one that matters: when everything else went wrong, what did gold do? Across gold’s two decades as an exchange-traded fund, the US share market fell in exactly three calendar years. Here are all three.
What gold did when shares fell — and what it cost the rest of the time
Calendar-year total returns in US dollars, dividends reinvested. Left: every year the US share market fell across gold’s two decades as an ETF. Right: gold’s own two worst years in the same period. Both are complete sets, not selections.
Both halves are the same deal. On the left, gold’s worst showing in a year shares fell was −1.9% — and 2022 is the one to look at twice, the year bonds dropped 13% alongside shares and gold finished roughly flat. On the right is what that cost: −28.3% in 2013 and −10.7% in 2015, while shares climbed. Insurance you are glad of three years in twenty, and pay for in most of the rest. Source: Yahoo Finance adjusted monthly closes (SPY, AGG, GLD), calendar years, as of 6 August 2026.
a theenoughpoint.com toolThat is the case for owning some, and it is narrower than the sales pitch. Gold did not rescue anyone when shares fell. It simply tended not to fall with them — and 2022 is the year worth a second look, because bonds, the usual shock absorber, dropped 13% alongside shares while gold finished roughly flat.
The bill for that insurance arrives in the good years. Gold fell 28.3% in 2013 and 10.7% in 2015 while shares climbed. The twenty-year slide after 1980 is the same charge paid over a generation. Even this year has the short-term version: gold sits about 24% below its late-January peak. It also fell into September’s Fed rate hike, as it did into four of the six first hikes before it; what followed those six is its own piece.
In plain English — gold has been useful in a handful of years and a drag through most of the others, and nobody is told in advance which kind of year is coming. That is what insurance actually feels like.
Households are not the only buyers reaching that conclusion. Central banks added roughly 1,000 tonnes a year in 2022–2024 — 1,082, then 1,037, then about 1,045 — around double their pace of the prior decade (World Gold Council). The pace is moderating, not reversing: 2025’s 863 tonnes was a fifth below 2024 yet still the fourth-largest year on record. And 2026 so far cuts both ways — heavy selling by a few banks dragged the first half to its lowest since 2022, while the second quarter alone set a record. “The central banks” are many actors, not one.
Central banks have been buying at roughly double their old pace
Net official-sector gold purchases, tonnes per year. This is the buyers’ case’s strongest verifiable number — reported here, not endorsed.
Source: World Gold Council, Gold Demand Trends. 2024 is approximate. 2025’s 863t was a fifth below 2024 yet the fourth-largest annual addition on record, with 230t in Q4 alone. The hollow bar is a half period and cuts both ways: H1 2026 nets 345t — the lowest first half since 2022, dragged by first-quarter selling from a few banks — yet Q2 alone was a record 288.9t, bought into a ~16% price fall. Read both facts together.
a theenoughpoint.com toolNone of that is a forecast. If you want one, take it from named publishers and read the incentive label first. The LBMA’s annual survey collects about thirty named analysts each January — bulls and bears in one table. The World Gold Council publishes scenario outlooks — rigorous, and from the industry body whose job is gold demand, which it says plainly. J.P. Morgan’s public long-term assumptions carry a gold figure for the next decade rather than the next quarter. This piece imports none of their numbers.
The five ways to own it — and what you actually own
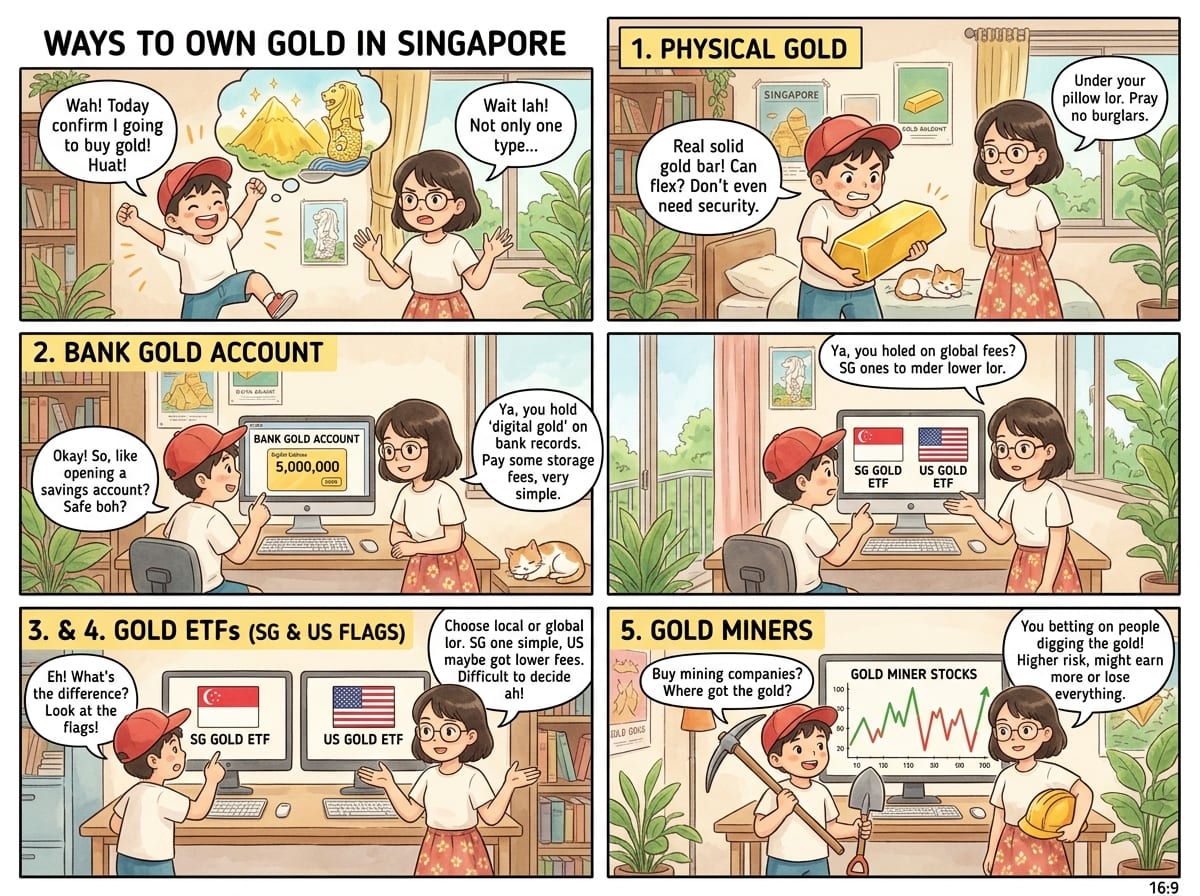
They are genuinely different assets: different things owned, different people between you and the metal, different law on the day it changes hands. Side by side first, then each in turn.
CPF-IS eligibility sits within the scheme’s 10% gold limit, above the first S$20,000 of OA. Costs are deliberately not in this table — the calculator below runs them on your own amount and horizon. Named funds are checkable examples, not picks.
a theenoughpoint.com tool1. Physical bullion
What you own. The metal itself — no fund, no counterparty, no annual expense ratio. Singapore made this deliberately easy: investment-grade gold of at least 99.5% purity, in tradable form, has been exempt from GST since 1 October 2012 (IRAS), a rule written to turn the country into a bullion hub.
What it costs. The dealer’s buy-sell spread going in and out, plus storage — a home safe and insurance, a bank safe-deposit box, or a private vault programme with insurance included. Vault operators publish their fee schedules; verify the current rates.
The catch. The estate question is physical. The metal is where it is, and your family needs to know where that is and how to access it.
2. A bank gold account
What you own. A claim on the bank — grams recorded against your name, no bars with your name on them. Fine for price exposure with minimal friction. It is not “an asset that is nobody’s liability”, because it is precisely somebody’s liability.
What it costs. The standing example is UOB’s Gold Savings Account: 0.25% a year of the highest balance recorded each month, plus GST on the charge, simplified from 1 April 2026 (the bank’s rates page).
The catch. Paper and physical are different products, and the door between them has a toll: converting the account into metal costs S$100 per 100-gram cast bar.
3. The two SGX-listed ETFs
What you own. Units in a trust holding allocated bars — same metal, different law. The fund listed here since 2006 is a US grantor trust. The one listed in March 2026 is a Singapore unit trust with its bars vaulted and insured in Singapore.
What it costs. 0.40% a year for the US wrapper — the record-setter above, and the only gold instrument CPF money can buy, within CPF-IS’s 10% gold limit. 0.39% for the Singapore wrapper, which is SRS-eligible.
The catch. The difference surfaces on the holder’s death. Singapore abolished estate duty in 2008, so the only death-tax question is a foreign one — and whether US estate tax reaches a grantor-trust unit is genuinely unsettled. The Singapore wrapper never raises the question. The US$60,000 / 40% mechanics are in the estate piece. One difference, not a verdict: the US fund is far larger, trades far more here, and is the CPF-eligible one.
4. Overseas-listed gold funds
What you own. The same trusts and their siblings, trading in New York in larger size, plus Europe’s gold ETCs — exchange-traded commodities — under UCITS fund rules.
What it costs. The published fund fee, plus a layer of FX and platform mechanics on top. For a worked example using share funds, the SGX ETF route-cost comparison separates the fund fee from currency conversion and platform charges.
The catch. For US listings, the estate question above applies at full strength. For equity funds, an Irish wrapper removes US estate exposure cleanly, and from 13 October 2026 some are due to trade on SGX itself; for gold there is no equally clean answer, because where an ETC legally sits does not follow from its UCITS label. If the death-law question matters to you, gold is the asset class where it is hardest to engineer away.
5. Gold miners
What you own. A business, not a metal. A miner’s share carries costs, management decisions, mine lives and mishaps — and because the costs are roughly fixed while revenue moves with the gold price, miners multiply gold’s moves in both directions.
What it costs. 0.51% a year for the standard US-listed miner fund (VanEck’s GDX); 0.53% for its Irish-domiciled twin listed in London (ISIN IE00BQQP9F84).
The catch. The leverage is violent in both directions. Across 2011–2016 the miner fund fell 77% with dividends counted while the metal lost 43%. In 2024 gold rose 26.7% and the miners managed 10.6%; in 2025 the same fund returned 154.8% against gold’s 63.7%. Same companies, same commodity, opposite outcomes in consecutive years.
In plain English — miners are a bet on businesses doing well out of gold, not a bet on gold. In the bad half-decade they fell nearly twice as far as the metal did.
Whether that leverage has actually paid depends almost entirely on where you start counting. Pick a window and you have picked a winner.
Did the miners beat the metal? It depends when you ask
Total return to August 2026, dividends reinvested. The metal through the gold fund (GLD), the miners through VanEck’s GDX — checkable examples, not picks. Both are US-listed and priced in US dollars.
The miners won four of these five windows — one, three, five and ten years. Gold wins only over the full twenty, and almost all of that gap is the 2011–2015 collapse still sitting inside the number. Pick a window and you have picked a winner.
These are destinations, not the journey. Getting to them meant sitting through a fall of 77% in the miners and 43% in gold — both with dividends reinvested, both bottoming in late 2015. On share price alone the miners’ fall was 81%. Source: Yahoo Finance adjusted monthly closes, 6 August 2026.
Two cautions before treating 2025 as the miners’ new normal. The sector did clean up — it spent the decade after 2015 writing off boom-era acquisitions and paying down debt. But costs have not stopped climbing: the industry’s average all-in sustaining cost — the World Gold Council’s measure of what an ounce costs to produce — reached US$1,456 for late 2024, rising 9% in a year. The 2025 bonanza is the gap between a price that sprinted and costs that walked. If that reverses, so does the leverage.
Access is the second caution. No miner ETF lists on SGX, and neither the US nor the Irish route is CPF or SRS eligible. The Irish fund does do one clean job: it holds shares rather than metal, so it is not US-situated property and the estate question never arises. Single miners add single-company risk on top of everything above.
The honest classification: a miner allocation is an equity position with a gold engine. It belongs in the equity part of your risk budget, sized the way you size equities.
What each route costs
The table above holds what does not change with your inputs; this prices what does. Published fund charges are prefilled, provider-dependent costs are marked illustrative until you replace them with your provider’s schedule, and no route carries a price assumption. Cost is the one column a comparison can honestly know.
Costs only — this tool assumes nothing about where the gold price goes. Three annual charges open at published figures: the two SGX funds (0.40% cap and 0.39% fee, June 2026), the bank account at 0.25% a year — UOB’s published Gold Savings Account charge from 1 April 2026, before GST on the charge — and the miner row at 0.51%, the published net ratio of the sector’s largest fund (VanEck’s GDX). All are checkable examples, not picks — set your own provider’s. Every other prefill — dealer premium and spread, storage and insurance, brokerage and FX — is illustrative: providers publish their schedules, and the right numbers are theirs, not ours. Change anything.
| Route | Going in % | Per year % | Coming out % |
|---|---|---|---|
| Physical bullion (IPM)illustrative — dealer premium, vault + insurance | |||
| Bank gold accountUOB GSA’s published 0.25%/yr (from 1 Apr 2026, before GST) as the example — set your bank’s; spread illustrative | |||
| SGX gold ETF — US trust0.40% published cap; trading costs illustrative | |||
| SGX gold ETF — SG trust0.39% published fee; trading costs illustrative | |||
| Miner fund (overseas-listed)GDX’s published 0.51% net ratio as the example — set your fund’s; FX + brokerage illustrative |
Going in and coming out are one-off costs; per-year runs for the whole holding period. Real annual fees are charged on value rather than a fixed sum, so treat this as a comparison of fee structures, not a bill forecast.
What this is. The cost side of five ownership routes on your own amount and horizon — entry, running and exit — computed on a constant notional so that no price path sneaks into a cost comparison.
What it leaves out. Returns, in every direction; miner dividends and the withholding tax on them; income and capital-gains treatment; FX drift on overseas listings; and the non-cost differences that may matter more — counterparty, CPF/SRS eligibility, and what happens on death — which are in the table above this tool.
What this is not. Advice or a ranking. The lowest-cost route at your horizon is a fact about fees, not a recommendation; the job you are hiring gold for comes first, and the piece takes no side on that.
a theenoughpoint.com toolWhere it sits in a plan — whichever route you pick
One mechanism survives every wrapper: gold pays no income. The metal in the vault, the ETF unit and the bank-account gram all pay their holder S$0 a year. The funds charge to hold it; the vault charges rent. The same money in a 6-month T-bill currently pays 1.59%, and 2.5% in a CPF Ordinary Account — the floor the rules guarantee. (Miners are the exception by being something else entirely — some pay dividends, because they are businesses.)
That has one practical consequence. An asset with no cash flow can only pay your bills by being sold, so a gold sleeve cannot sit in the layer of your plan that pays essentials — that layer runs on coupons and cash flows.
What the sleeve buys instead is a choice in bad years. When the rest of the portfolio has fallen and gold has not, the bills can come from the sleeve, sparing depressed assets at their lows — and vice versa. Both sides of that deal are real. The premium — the forgone yield plus the wrapper’s running cost — is paid every year without fail; the option pays only in the years the two sides part ways. Price them together, never separately.
In plain English — gold does not pay you to wait; you pay it. What the payment buys is the right, in a bad year, to sell the thing that has not fallen.
So what do you do?
Four steps, and not one of them is “buy something today”.
-
Start with the job, not the route. Insurance held outside the financial system means physical metal. Price exposure using CPF money has exactly one route. A leveraged bet on the gold price means miners — an equity bet, sized like one.
-
Price it for your horizon. Spreads punish short holdings; annual fees punish long ones. The calculator above settles that in a minute.
-
Check whose law your wrapper answers to. It is the difference the brochures skip, and an evening on it now is cheaper than a probate lawyer later.
-
Then finish this sentence: “I am holding gold because ___.” If it finishes easily, you have your size. If it will not finish, you have your answer.
Sources and verification — primary where it matters, verified 6 August 2026. Every load-bearing figure below, one line each.
- GST exemption for investment precious metals (≥99.5% gold, qualifying forms, from 1 Oct 2012): IRAS e-Tax Guide, GST: Guide on Exemption of Investment Precious Metals.
- Central-bank purchases (1,082t / 1,037t / ~1,045t in 2022–24; 863.3t in FY2025, the fourth-largest year on record with 230t in Q4; H1 2026 net 345t, the lowest first half since 2022, containing a record 288.9t Q2 bought into a ~16% price fall; ~473t average 2010–21): World Gold Council, Gold Demand Trends (Q4/FY2025 and Q2 2026 editions).
- Bank gold-account charge (0.25% a year from 1 Apr 2026, GST on the charge; previously the higher of 0.12g a month or 0.25%, which quietly made small balances dearer; S$100 per 100g physical conversion): UOB’s published rates page, checked 6 August 2026.
- Miner fund, named as a checkable example: VanEck Gold Miners ETF (GDX), 0.51% net expense ratio per the issuer.
- The window comparison (total returns to August 2026 — 1yr: gold +22.5% vs miners +33.4%; 3yr: +116.4% vs +196.2%; 5yr: +129.6% vs +175.1%; 10yr: +212.3% vs +262.0%; 20yr: +525.5% vs +142.9%): computed by us from the same Yahoo Finance adjusted monthly closes, dividends reinvested.
- The Irish-domiciled miner fund: VanEck Gold Miners UCITS ETF, ISIN IE00BQQP9F84, Ireland-domiciled, listed in London, 0.53% ongoing charge — named as a checkable factual example of a non-US-situs route, not a recommendation.
- The 2024 and 2025 miner-versus-gold figures (gold +26.7% against miners +10.6%; then gold +63.7% against miners +154.8%): computed by us from Yahoo Finance adjusted monthly closes, calendar-year total returns in USD.
- Miner sector economics (industry average all-in sustaining cost US$1,456/oz, up 9% year on year, with 97% of primary gold production profitable): World Gold Council, Ever upwards for AISC, Q3 2024 data — the WGC’s own published commentary, and the most recent industry-wide figure we could verify; on the same trend it is higher now, so do not measure today’s gold price against it and call the difference the margin. Verified 6 August 2026, replacing an earlier draft’s US$1,600/oz, “record free cash flow”, “net cash at some producers” and “widest margins in fifteen years”, none of which we could confirm beyond secondary coverage. They are not claimed here.
- The 2011–2016 drawdowns (miners −77%, or 81% on share price alone; gold −43%): computed by us from the same series — total returns are month-end adjusted closes, the share-price figure is raw monthly high to raw monthly low. Both funds are US-listed and USD-priced, so a Singapore holder’s own result also carries the SGD/USD path; the window comparison above is a set of ratios and is unaffected by it.
- The bad-years chart: computed by us from Yahoo Finance adjusted monthly closes (dividends reinvested), calendar-year total returns in USD — shares via the S&P 500 tracker (SPY), bonds via the US aggregate bond tracker (AGG), gold via GLD. Both halves are complete sets, not selections: 2008, 2018 and 2022 are every calendar year the S&P 500 fell across gold’s ETF era, and 2013 (−28.3%) and 2015 (−10.7%) are gold’s two worst calendar years in the same period. Gold’s worst showing in a year shares fell was −1.9%. (Also computed and not used: gold’s monthly moves track the change in the 10-year real yield at −0.46 and its level at only +0.10 — the direction matters, the level barely does. True, but a macro relationship a reader cannot act on, so it did not earn a chart.)
- Fund ranks, flows, eligibility and the SGX full list (no miner ETF listed): SGX, ETF Market Highlights 1H2026 (data 30 June 2026).
- Fund structures and charges: SPDR Gold Trust prospectus (SSGA); Lion Global Investors fund documents.
- CPF-IS gold and stock limits, first S$20,000, OA floor: CPF Board.
- Estate mechanics and the unsettled grantor-trust situs question: as sourced in our estate piece (IRS 706-NA and 706 instructions; as far as we could establish from primary sources, the uncertainty is genuine — documented there and not resolved here).
- 1980–1999 gold path (about US$850 in January 1980 to about US$252 in August 1999, roughly −70% nominal): not independently verified, and reported as such. These are among the most widely documented figures in market history — the US$850 London afternoon fix of 21 January 1980, and a low of US$252–253 in the last week of August 1999 — but the canonical LBMA fix series was withdrawn from public access in March 2025 at ICE Benchmark Administration’s request and is now licensed, so we neither pulled it nor cite it: we will not publish figures we cannot check ourselves. The arithmetic on the quoted figures is −70.3%.
- Miner endpoints (about US$67 in September 2011 to about US$12 in January 2016, an 81% fall in share price): verified 6 August 2026 against the fund’s own raw monthly price bars — high US$66.98 (Sep 2011), low US$12.40 (Jan 2016), −81.5%. Secondary write-ups cite US$66.63 and US$12.47; we use our own rounded figures. An earlier draft’s “+151% in under seven months, while gold rose 24%” has been removed: that pairing measures trough-to-peak, whereas every other figure in this piece is month-end close to month-end close, and on the consistent basis the same window is +79% against gold’s +17%. Mixing the two would be the very thing this piece warns about.
- Gold’s decline to its late-2015 trough (roughly 43%): verified from GLD month-end adjusted closes — peak August 2011, trough December 2015, −42.9%. On raw monthly high-to-low it is −46.1%; we quote the month-end basis used everywhere else.
- Gold down about 24% from its January 2026 peak: computed from GLD’s own price bars — January 2026 high US$509.70 to early-August close US$389.64, −23.6%. This replaces an earlier draft’s press-reported “US$5,500 peak, about US$4,050 in early August”; cross-checking those against GLD suggested the August figure may understate, and a percentage move from a verifiable series avoids relying on spot levels we cannot confirm.
- Where published gold views live, with incentives labelled: LBMA annual forecast survey; World Gold Council outlooks and Qaurum, its valuation tool; J.P. Morgan’s public Long-Term Capital Market Assumptions — none of their numbers are used here.
Deliberately not claimed: whether gold, or any route into it, has upside from here — the piece assumes you have heard that case and prices the execution instead. Any ranking of routes or providers — every named product or scheme is an illustrative, checkable example. Any resolution of the grantor-trust situs question.
General information and education only: this is not financial, tax or legal advice, and it takes no account of your objectives, situation or needs. Estate matters interact with wills, other jurisdictions and rules that change; a qualified adviser earns their fee here. Figures are computed from the sources above; verify the current position before relying on them.