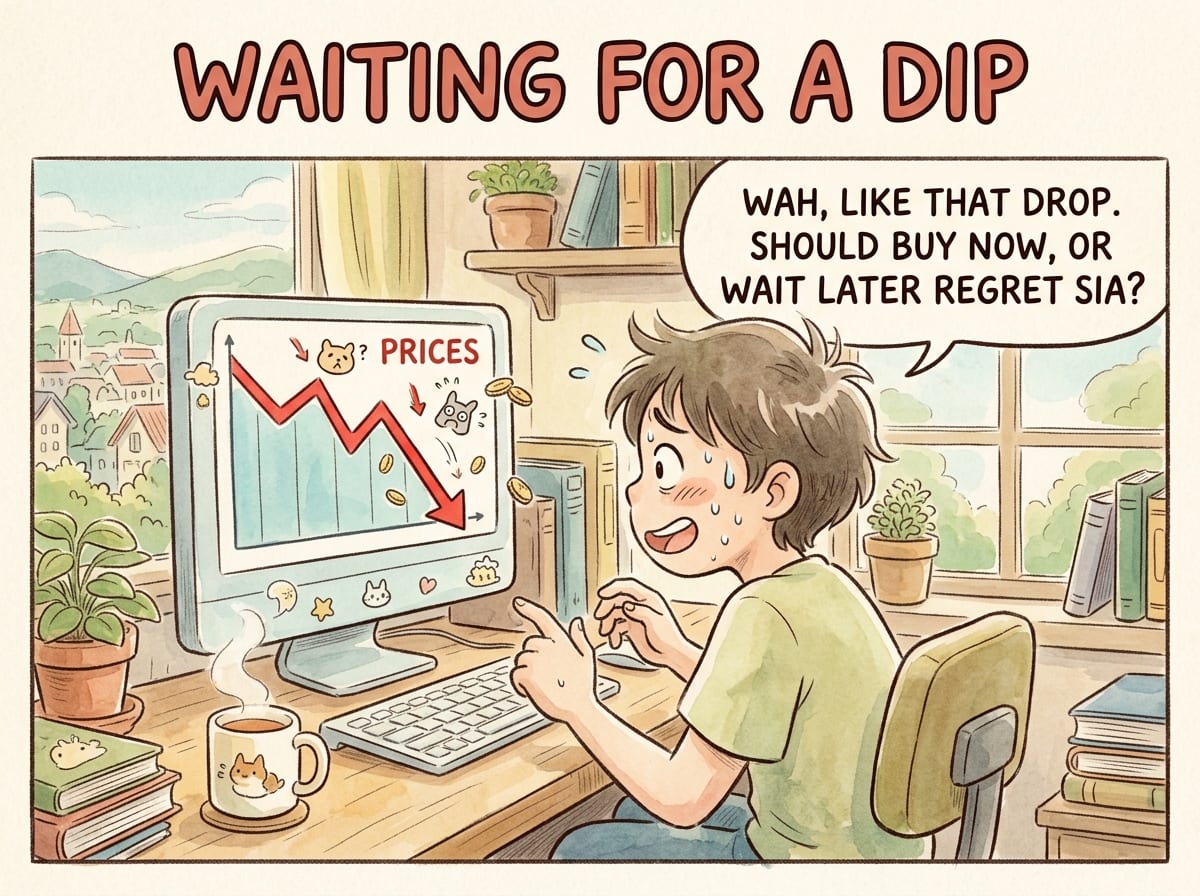
You have money to invest. The market has run hard and everything looks expensive. So you settle on a plan that feels prudent rather than passive: you will wait for a pullback. Five per cent, maybe ten. Then you will buy.
It is not a silly plan. It is disciplined, it has a rule, and it avoids the thing you most fear — putting everything in on one day before a fall.
There is only one question the plan never asks. What happens if the dip does not arrive?

The dip you are waiting for is not guaranteed to come
We ran the rule properly, which means giving it a deadline. Hold the cash. The moment the market falls by your chosen amount from its running peak, put everything in. If it has not happened within two years, put the money in anyway — because “wait indefinitely” is not a plan, it is a way of never investing.
Then we asked, across 1,794 starting months of US market history since 1871: did waiting actually beat simply buying on day one?
waiting beat day one 42 times in 100
waiting beat day one 36 times in 100
waiting beat day one 32 times in 100
waiting beat day one 25 times in 100
The hairline marks half. On the shallowest rule the margin is inside the uncertainty of a 97-year sample — call that one a draw. From 10% down, waiting clearly lost.
But what if the waiting cash earned interest?
Everything above gives it nothing. Here is the same question — how often waiting beat buying on day one — with the cash earning the Treasury bill rate of each month it actually sat there.
| Waiting beat day one | Cash sits idle | Cash in T-bills |
|---|---|---|
| waiting for a 5% fall | 41% | 46% |
| waiting for a 10% fall | 33% | 38% |
| waiting for a 15% fall | 29% | 34% |
| waiting for a 20% fall | 23% | 30% |
Both columns run 1926–2023, the years a bill rate exists. That is a shorter stretch than the bars above, which is why the idle column reads 41 rather than 42 — same measure, fewer years. Interest helps everywhere and still never reaches half. It changes the size of the gap, not the answer.
The stricter the rule, the worse it did — from 42 in 100 down to 25 in 100. The reason is not that a bigger discount was a worse prize. It is that you collected it far less often.
Fall measured from the market’s running peak since the money arrived. Deployed in full on the first month the fall is reached, or at 24 months regardless. Outcome compared 36 months after the money arrived; cash earns nothing. Shiller US data (Yale), total return, 1871–2023. Our computation.
a theenoughpoint.com toolWaiting for a 5% pullback beat buying immediately 42 times in 100. Waiting for 20% managed 25. The stricter the rule, the worse it did.
One honest qualification before going further. A century of overlapping windows is fewer independent observations than it looks, and on the shallowest rule — waiting for a mere 5% — the margin sits inside that uncertainty. Call that one a draw. From 10% down the gap is wide enough that the sample cannot explain it away.
Those figures assume your cash earns nothing while it waits, which is the assumption almost every version of this argument makes without saying so — including the Vanguard study most people are quoting. It is worth testing rather than asserting.
So we gave the sidelined money the actual one-month Treasury bill rate, month by month, rather than a flat guess. That matters because the rate was not one number: it averaged 3.3% a year but sat at 0.5% through the 2010s and 8.9% in the 1980s, and those are exactly the stretches where waiting looks best and worst.
Over 1926 to 2023 — the years a bill rate exists, so a slightly shorter run than the figures above — earning interest lifts waiting from 41, 33, 29 and 23 times in 100 to 46, 38, 34 and 30. That is genuine interest rather than none, not an inflation-adjusted number.
Better everywhere. Still never half. Where you park the money changes the size of the gap, not the answer.
The reason is not the one most people would guess, and it is worth a moment.
Hold out for a 5% pullback and you usually got one — 81% of the time, after a typical wait of seven months. Ask for 15% and you never got to buy the fall in 65% of starts. Ask for 20% and you failed in 78%. For most of those starting months the plan was never really tested, because the thing it depended on did not happen. It quietly became something else: sitting in cash for two years, then buying anyway, at whatever price the market had reached by then.
In plain English — the deeper the discount you insist on, the more likely it is that you never get to use your plan at all, and simply spend two years out of the market instead.
And when it did come, it usually came at a higher price
This is the part that defeats the intuition. A dip is a fall from wherever the market got to, not from where it was when you decided to wait. Markets rise more often than they fall, so by the time your 10% correction arrives, the level it is correcting from is frequently above the price you passed up.
You get your discount. You just get it on a higher number.
Here the argument gets more interesting than it first looks, and it is worth being precise because the obvious version is wrong.
When the fall did arrive, waiting paid — and it paid better the deeper the fall you had demanded, from 52% of the time on a 5% rule to 90% on a 20% rule. A big discount is not a bad prize. Holding out for one is simply a bet you rarely get to collect.
So day one wins in aggregate — 58% of the time against a 5% rule, 75% against a 20% rule — almost entirely because the fall so often never comes, and not because the fall was not worth having.
But surely at a high it is different
This is the strongest form of the objection, and it deserved a proper test rather than a reassurance. If markets are at a record, the odds must shift.
We grouped every starting month by what an investor could actually have seen at the time — how close the market sat to its own running peak, and what the previous twelve months had done.
The hairline on each bar marks a coin flip.
The one condition where spreading the money out did relatively well was buying after a large fall — precisely the moment nobody feels like buying anything.
Starting months grouped by what was visible at the time: distance from the market’s own running peak, and the prior twelve months. Three monthly instalments, outcome after one year, cash earns nothing. Shiller US total return, 1871–2023. Our computation.
a theenoughpoint.com toolStarting from an all-time high, investing at once beat spreading the money out 70% of the time, against 64% across all starting months. After a year in which the market had already gained more than a fifth, 71%.
Buying at a high was not the trap. It was slightly better than average — because markets at highs are usually there for a reason, and they spent much of the next year making new ones.
Look at the bottom bar, though, because it is the honest half. The one condition where spreading the money out did relatively well was buying after a large fall, when the market was already more than 20% below its high. That is precisely the moment nobody feels like buying anything.
Spreading it out slowly costs more than spreading it fast
Suppose you are unpersuaded, and you want to phase the money in anyway. There is a right and a wrong way to do it, and the difference is bigger than most people expect.
| How you spread it | Fully invested after | US since 1871 | Developed since 1990 | Singapore since 1987 |
|---|---|---|---|---|
| Three, a month apart | 2 months | 64.2% | 64.1% | 58.0% |
| Four, a month apart | 3 months | 65.4% | 65.9% | 57.6% |
| Three, a quarter apart | 6 months | 69.2% | 68.7% | 60.8% |
| Four, a quarter apart | 9 months | 71.6% | 71.7% | 62.5% |
Read any column downwards. Getting invested over 2 months rather than 9 is worth roughly 7 percentage points in the US and Developed columns. It is the same four purchases either way — what changes is how long the money sits out of the market.
Each column runs on its own history, so read down a column and not across a row. Cash earns nothing while it waits. The Singapore series is a price index plus an assumed 2.6% dividend yield; these instalment figures barely move across a 0% to 3.5% assumption, unlike the dip figures elsewhere in this article. Our computation.
a theenoughpoint.com toolThe pattern is the same everywhere: the cost is the waiting, not the splitting. Three or four purchases over a couple of months costs relatively little. The same number of purchases spread across a year costs considerably more, because the money spends longer out of the market. Speed, not the number of purchases, is what you are actually choosing.
Where waiting genuinely held up
Two concessions, both real.
The first is that this gets much closer in volatile markets. In emerging markets a 5% dip arrived in 99.5% of starts, and waiting for it was a coin flip. Singapore looks similar, though we would not lean on the Singapore figures here: the index we have going back to 1987 carries no dividend data, so we have assumed a yield, and the dip results — unlike the instalment results — move enough with that assumption to change the conclusion. Take them as directional only.
Part of the reason it gets closer is that in those markets you were barely waiting at all — a median of five months — so the “strategy” was mostly just a short delay. But emerging markets are a genuine exception rather than an artefact: there, investing immediately won only 52% to 54% of the time at every depth we tested, from 5% down to 20%. That is as close to a real draw as anything in this article, and it is the one place where waiting was not a mistake.
The second is that none of this says spreading out is worthless. Vanguard modelled investor preferences and found that someone who feels losses more sharply than equivalent gains is genuinely better off phasing money in — lower expected return included. If a sharp fall in month one would have you selling everything, then paying something to avoid that is not weakness. It is buying the thing that actually matters, which is staying invested.
Set your own rule
So what do you do
Waiting for a dip is not a strategy until it has a deadline. Without one, “I will buy the next correction” is not a rule — it is a mood, and moods are why people hold cash for years and then buy at the top anyway. A Fed rate hike is the kind of headline that turns the mood into a plan; what actually followed the six previous first hikes is its own piece.
Phasing in over a couple of months costs little. The same purchases dragged across a year is where the real money goes.
Then there is the cash itself. The headline figures here give it nothing, because that is what almost every version of this argument assumes without saying so. We also ran it with the real bill rate, which improved every rule and changed none of the answers — and of everything on this page, it is the cheapest thing to change in your own arrangements.
The market being high is a genuine fact about your expected returns. What it is not — outside the most volatile markets, where the wait is barely a wait — is a reason to hold cash for a 15% discount that showed up about a third of the time.
Check it yourself
We would rather you did not take our word for it. The rule is simple enough to re-implement in an afternoon, both datasets are free, and the figures you should get are printed below.
The rule, stated exactly
- Pick any month from 1871 onwards. You have a lump sum and you hold it in cash.
- Track the market’s highest close since that month.
- The first month it closes X% below that running peak, invest the lot.
- If that has not happened after 24 months, invest anyway.
- Compare where you stand 36 months after the start against having invested everything on day one.
- Repeat for every starting month and count how often waiting came out ahead.
The deadline in step 4 is the part that matters. Without it the rule has no answer on the paths where the fall never arrives — and dropping those paths keeps only the runs where waiting got its chance, which will prove whatever you like.
What you should get
| Rule | Fall arrived | Median wait | Waiting won, cash idle | Waiting won, cash in T-bills |
|---|---|---|---|---|
| 5% fall | 81.1% | 7 mo | 42.5% | 46.4% |
| 10% fall | 53.3% | 10 mo | 35.5% | 37.8% |
| 15% fall | 35.5% | 12 mo | 32.2% | 34.4% |
| 20% fall | 22.0% | 13 mo | 25.4% | 29.6% |
Cash idle means the money you are holding back earns nothing while it waits, which is what almost every published version of this comparison assumes. Cash in T-bills gives it the actual one-month Treasury bill return of each month it sat there — not an inflation-adjusted figure, just genuine interest instead of none.
First four columns run on US shares 1871–2023, 1,794 starting months. The T-bill column runs 1926–2023, the years a bill rate exists, so it is not directly comparable with the column beside it — on those same years the idle-cash figures are 41.0, 32.5, 28.7 and 22.7%. Small differences are expected if you handle months with no dividend figure differently from us.
Or run ours
Download the script — one file of Python, about 150 lines, written to be read. It fetches both datasets itself, recomputes every figure above and prints OK or MISMATCH against what we published. If you get a mismatch, we would genuinely like to hear about it.
To be exact about what it is: a standalone re-implementation written for publication, not the internal pipeline that produced the article. We checked it reproduces every published figure before shipping it — and writing it caught a real error in our own reasoning, a shortcut that returned a 115.7% probability. That is the argument for publishing code rather than describing it. Provided as is; the datasets belong to their authors.
pip install pandas numpy requests xlrd
python waiting-for-a-dip.py
The data
- Shiller, US prices and dividends from 1871 (Yale) — the
Datasheet, columnsPandD - Kenneth French, research factors (Dartmouth) — the
RFcolumn is the one-month bill rate
Where our numbers are soft
Everything above is our computation, so here is where we would push back on it hardest.
- A century of overlapping windows is fewer independent observations than it looks. Adjacent starting months share almost all of their path. Resampling in 36-month blocks to respect that, the 5% rule lands at 46% with a range of roughly 39% to 54% — which is why we call that one a draw rather than a loss. The 10%, 15% and 20% rules sit clear of half on the same test.
- The answer is era-dependent even though the conclusion is not. On 1930s starting months the 15% rule beat day one 45% of the time; on 2010s starting months, 17%. Dropping any single twenty-year block leaves the full-sample figure between 32% and 37%, so no one era is carrying it — but the spread is wide and worth knowing.
- The rule is one formalisation of many. We measure the fall from the running peak since you started waiting. You might reasonably measure from the all-time high instead, or deploy in stages, or allow longer than two years. The direction survives across four depths, four markets, three deadlines and three horizons; the exact percentages belong to this definition.
- Singapore is the weakest leg. The index we have from 1987 carries no dividend data, so we assumed a 2.6% yield calibrated on the years where both exist. The instalment figures barely move across a 0% to 3.5% assumption. The Singapore dip figures move by about nine points, which is why they appear only as a directional aside.
- The US series ends in September 2023, so the last two years are missing from the long history. On a 152-year hit rate that is immaterial, but it is not nothing.
Sources
Every source below is free and public, so you can check any figure yourself.
- Long US history — Robert Shiller’s dataset (Yale), monthly 1871 to 2023, price and dividends, used to construct total returns.
- Developed and emerging markets — Kenneth French’s data library (Dartmouth), monthly US dollar market returns from 1990 and 1989 respectively.
- The cash rate — the one-month Treasury bill series in French’s research factors file, monthly from July 1926, applied month by month rather than as a flat assumption.
- Singapore — Straits Times Index price history from 1987 plus an assumed constant dividend yield, calibrated against the measured gap between the index and a dividend-paying tracker over 2008 to 2026. This is the one assumed input here, and the Singapore dip figures move materially with it.
- The loss-aversion finding is Vanguard’s computation, from Cost averaging: invest now or temporarily hold your cash? (Finlay and Zorn, February 2023).
All dip-arrival, entry-condition and instalment figures are ours. Entry conditions use only information visible at the starting month — no hindsight.
Past performance is no guarantee of future returns. This is general information about how these approaches have behaved, not advice about your circumstances.