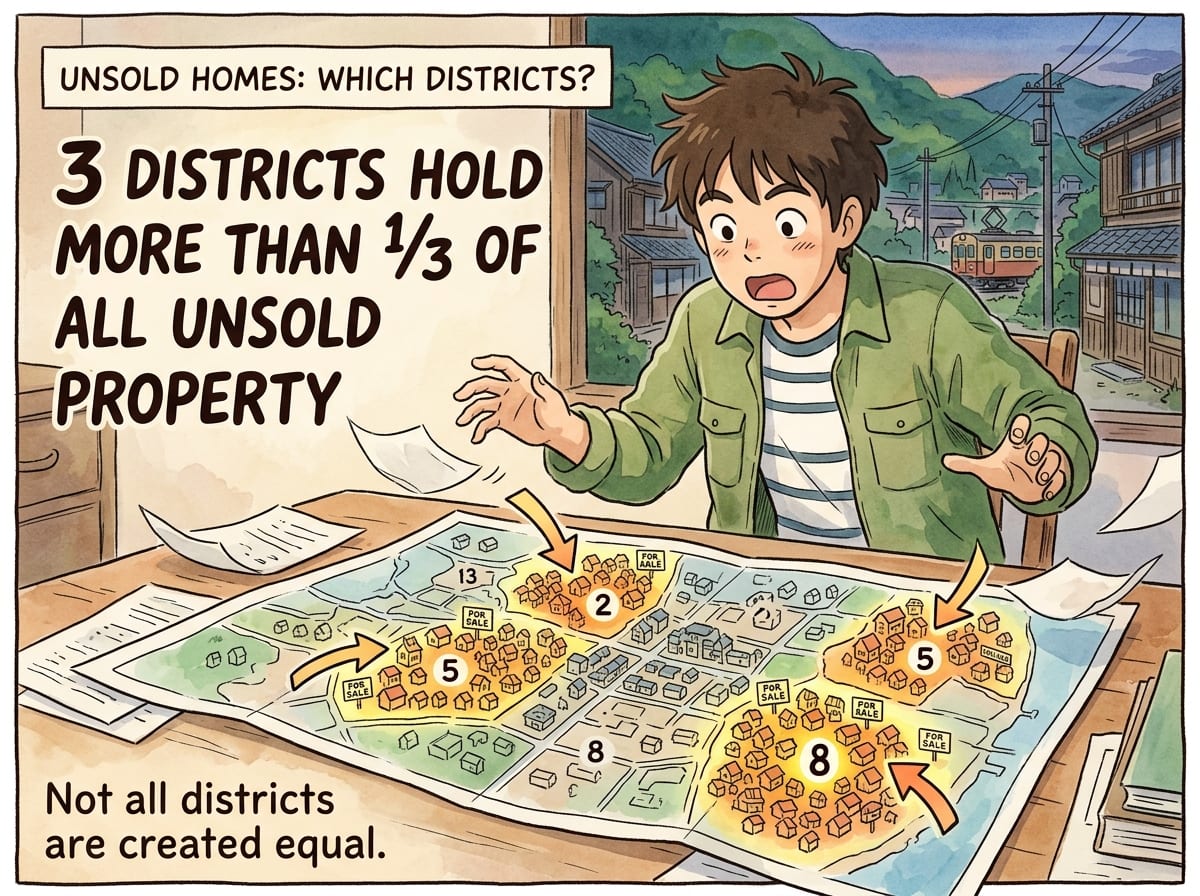
If you have read anything about Singapore property this year, you have met the number. Around 34,000 unsold private homes — all of them new, developers’ stock rather than anything on the resale market. It gets quoted in headlines, in agent decks, in comment sections, usually with an air of warning — as though it were a fact about the flat you are considering.
It is a real number, and it comes from a good source. It is also national. Nobody buys the nation.
Property is the least fungible asset most people will ever own. An unsold flat in one district does nothing to the price of a flat eight kilometres away, in a different school catchment, on a different MRT line. The unsold homes in that figure have to physically be somewhere. So we went and added up where.
Where the number comes from
At the end of June 2026, the Urban Redevelopment Authority counted 42,472 private homes in the pipeline with planning approval, of which 15,810 were unsold. On top of that sat a further 18,153 unsold units that had not been granted planning approval at all.
Add those together and you get the roughly 34,000 that everybody quotes.
Notice what has just happened. More than half of the headline figure is homes with no planning approval yet — sites, permissions and intentions rather than flats. Some are on government land that has been sold but not built. Some are on land not yet released. They will arrive, and they matter, but they are years from a showflat and they are not competing with you this weekend.
What is actually for sale, and where
The homes that compete with a buyer today are the ones in projects that are open and selling now. That is published monthly, project by project, and it can be added up by district. Across every project still selling in the latest data, 3,645 units were unsold out of 22,829 launched — about 84% sold overall.
Here is where those 3,645 sit.
The unsold stock is concentrated, not spread
Unsold new homes by district, across every project still selling, URA's monthly developer-sales record, as at June 2026. Three districts hold 36% of it. Five have no active launch at all.
- D1 Raffles Place / Marina63%
- D9 Orchard / River Valley72%
- D23 Bukit Batok / Choa Chu Kang74%
- D5 Buona Vista / Clementi / Dover83%
- D21 Upper Bukit Timah / Clementi Pk75%
- D3 Tiong Bahru / Queenstown81%
- D22 Jurong80%
- D15 East Coast / Marine Parade91%
- D17 Changi / Loyang82%
- D16 Bedok / Upper East Coast84%
- D28 Seletar / Yio Chu Kang20%
- D7 Bugis / Beach Road36%
- D12 Balestier / Toa Payoh89%
- D10 Bukit Timah / Holland81%
- D26 Upper Thomson / Mandai97%
- D2 Tanjong Pagar / Anson81%
- D18 Tampines / Pasir Ris98%
- D27 Sembawang / Yishun90%
- D19 Serangoon / Hougang / Punggol96%
- D25 Woodlands / Kranji91%
- D6 City Hall / Clarke Quay99%
- D11 Novena / Newton99%
- D24 Lim Chu Kang / Tengah100%
- D4 Sentosa / Harbourfront
- D8 Little India / Farrer Park
- D13 Macpherson / Potong Pasir
- D14 Geylang / Eunos
- D20 Bishan / Ang Mo Kio
Not “a little unsold stock” — no project in these districts recorded developer sales this month. That is a narrower claim than zero unsold homes: a project that has sold out, or has not launched, does not appear at all.
Across every project still selling, 3,645 units were unsold out of 22,829 launched — 84% sold overall. The top three districts hold 36% of everything unsold and the top five hold 53%. Note that a long bar and a low per cent sold are different problems: some districts appear high because they launched a great deal and are selling it, others because they are not selling.
Computed by us from URA’s developer-sales record for June 2026, covering 23 districts with at least one project still selling. Per cent sold is cumulative since launch, not a rate — the published file carries no launch date, so a long-selling project and a new one cannot be told apart in it, and the figure should not be read as demand in either direction. New sales only; resale listings are excluded throughout. Districts 6 and 24 carry too few private resales for our district table to name them, so they use the standard postal-district descriptors.
The top three alone — Raffles Place, Orchard and Bukit Batok — hold more than a third of every unsold new home in the country that is actually on sale. Take the top five and you pass half. Hold on to that number, because five is also how many districts have none at all.
That is a very different sentence from “Singapore has a glut”. Two of those three are city-centre districts where the product is expensive and the buyer pool is thin, and one is a suburban district that has had several large projects launch close together. Each is a local story with a local cause.
Five districts where the glut simply is not
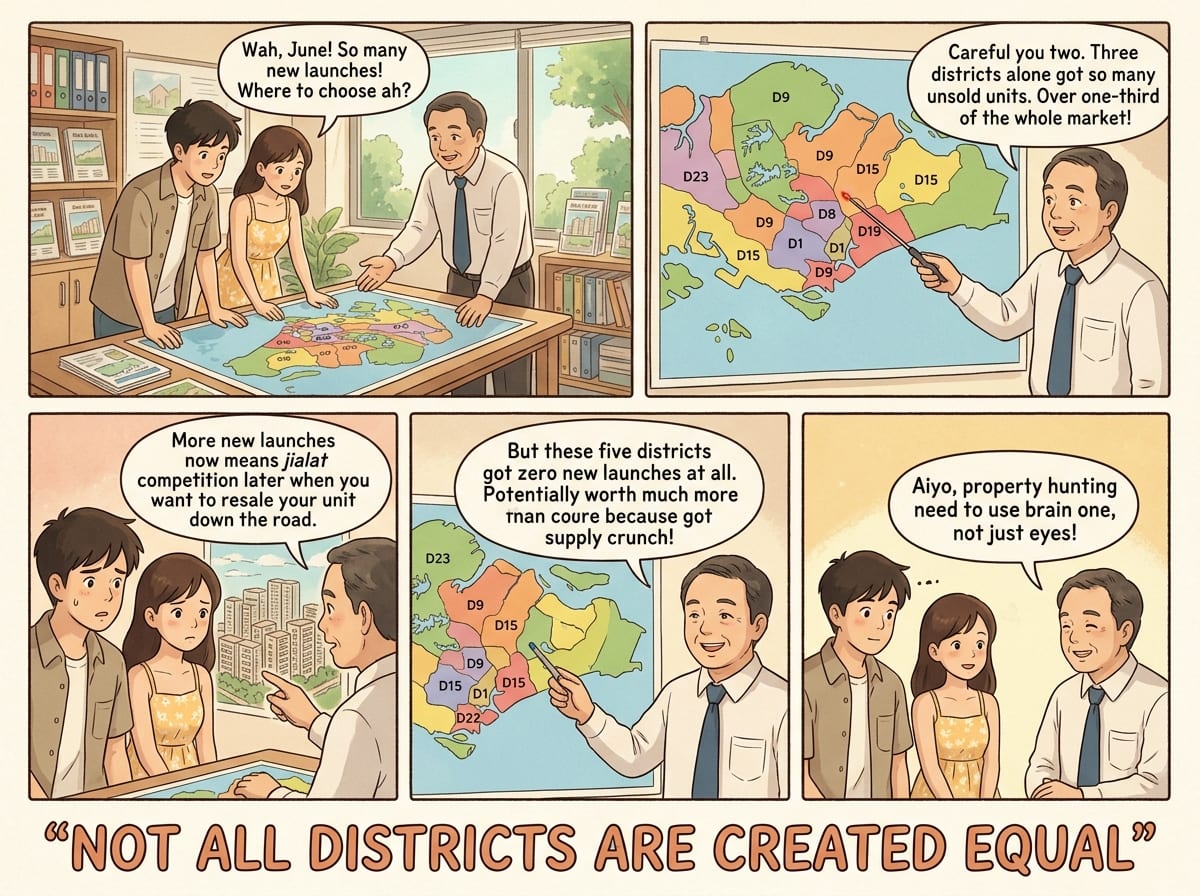
Five districts hold half the unsold stock. Run the same exercise the other way and a different five appears — the ones with no active launch in the data at all: Sentosa and Harbourfront, Little India and Farrer Park, Macpherson and Potong Pasir, Geylang and Eunos, and Bishan and Ang Mo Kio.
Not “a small amount of unsold stock”. None on the list.
Read that carefully, because it is easy to over-read. It means no project in those districts recorded developer sales activity that month. It does not mean zero unsold homes exist there — a project that has sold out, or one that has not launched yet, simply does not appear. But it does mean that in those five places, the national glut headline is describing a market that is not on their doorstep.
What local supply actually does to a flat
If the number that matters is local, the next question is what local supply does when it lands. It re-prices the buildings around it — a new launch sets a fresh benchmark, and every nearby condo starts getting judged against it. Buyers begin asking why they would pay a certain figure for the older block when the new one is asking a certain other figure.
That much is real and worth thinking about. What is much harder than it looks is measuring it on any particular pair of buildings.
Take two in Queenstown — District 3, in the rest-of-central region this article has been describing. Principal Garden and The Crest sit in the same pocket, both inside about 700 metres of Redhill MRT — 699 and 542 respectively — with 87 and 85 years of lease left. Stirling Residences launched nearby and now resells at S$2,384 per square foot, well above both. On the last twelve months of URA resale data, Principal Garden’s median is S$2,134 and The Crest’s is S$2,000: a gap of 6.7%.
The tidy story writes itself. Same neighbourhood, same walk, one pulled ahead — so it must be something about how each relates to the new benchmark.
Two things get in the way of that story.
The buildings are not like for like. Principal Garden’s median resale unit is 764 square feet; The Crest’s is 936 — 18% larger. Smaller flats carry a higher price per square foot nearly everywhere, which is the central finding of our own work on district yields. Some unknown part of that 6.7% is floor area rather than benchmarking.
And the gap moves with the window. Over the last twelve months Principal Garden’s median is down 1.4% while The Crest’s is up 3.4%. Whichever way the comparison ran in an earlier window, it does not run that way now — which is the same trap the measurement window sets for anyone comparing new launches with resale.
None of this makes the benchmark effect imaginary. It says the effect is entangled with unit mix and with the dates you choose, and that a two-building comparison cannot separate them. Any time you are shown one pair and one large number, those are the two things that have usually gone unmentioned.
What survives is narrower than a number, and more useful. When a launch lands near a block you are looking at, the question is not whether prices went up. It is whether the older block has an answer to the new one — a reason someone would still choose it knowing exactly what the new building costs. More space for the money. A longer lease. A quieter stack, a shorter walk, a layout the new one does not offer. If the only honest answer is that it is cheaper, that is the block the new benchmark works against, and no aggregate number will tell you which of the two you are standing in. That one you have to answer at the viewing.
Two things the data will not tell you
There is no launch date. The published file gives units launched and units sold, so “per cent sold” is cumulative since the project opened. A development three years into its selling life and one that opened six weeks ago appear the same way. A low figure can mean weak demand or it can mean recent — and nothing in the data separates them. Anyone quoting take-up as evidence of demand, in either direction, is quoting a number that cannot carry the weight.
It counts new homes only — and new homes are the minority of the market. Resale was 62.0% of all private sale transactions in the second quarter of 2026, some 3,813 deals. The famous glut number therefore describes the smaller share of what actually changes hands. In an established district, most of what you would be bidding against is somebody else’s flat, not a developer’s.
And there is no equivalent figure for resale. Singapore publishes no count of how many existing homes are on the market at any moment — URA reports resale transactions, never resale listings, and portal counts are unverified and heavily duplicated. The nearest official proxy is the vacancy rate for completed private homes: 6.4% at the end of June, up from 6.2%, and 8.3% in the core central region against 5.6% outside it. But a vacant flat is not necessarily a flat for sale — it may simply be between tenants. Anyone quoting you a total unsold figure that includes resale has estimated it, not measured it.
What to take from this
The national figure is not noise. It is the right number for the questions it is actually about: whether the government releases more land, whether developers bid cautiously at the next tender, whether the market as a whole has room to run. It is simply not a number about a postcode. In the same quarter this year, prices moved in three different directions across the three market segments while the national index rose 0.5%.
Which gives a rule you can carry into a viewing: a national number cannot re-price your flat, and a launch three hundred metres away can. The radius that matters is the one buyers actually choose between — the blocks a person would genuinely weigh against each other on the same afternoon. Everything wider than that is context, not competition.
So when you next meet a supply figure — in a headline, a video, or from someone with a commission riding on your decision — three questions turn it back into something usable.
Over what area? National, segment, or district. If the person quoting it cannot say, they do not know what they have quoted.
Counting what? Launched and unsold is a different thing from approved-but-unbuilt, which is different again from land the government has not released. Roughly half the famous number is the third category.
A total or a rate? How many are unsold tells you little without how fast they are selling — and the free public data does not carry the launch dates that would let anyone work that out.
None of this says the market is safe, and none of it says any district is a good buy. It says the number most often used to answer that question was never about your district in the first place.
Where to take it next
Two other pieces run the same public data at the question underneath this one.
Does a cheaper district pay more rent? — every private district on price against yield. The rule everyone repeats does not hold, and what actually moves yield is the size of the flats, not the postcode. If this article told you supply is local, that one tells you what the local number is worth.
Half the property internet says buy resale. The other half says buy new. — the other figure a new-launch buyer meets on day one. It carries a calculator that shows what buying new instead of existing costs per square foot in your segment, on your own budget. Unlike per cent sold, that one is a number you can act on today.
Sources, and where our numbers are soft
Sources
- Pipeline and unsold-unit figures: URA, Release of 2nd Quarter 2026 real estate statistics, 24 July 2026 — 42,472 units with planning approval, 15,810 of them unsold, and 18,153 unsold units without planning approval. Quarterly price movement by market segment is from the same release.
- Forthcoming land supply: URA, Government Land Sales programme for 2H2026, 3 June 2026 — 9,320 units on the full-year Confirmed List, stated there as more than 50% above the annual average of the past ten years.
- Vacancy rate, resale transaction count and resale share of sales: URA, Release of 2nd Quarter 2026 real estate statistics, 24 July 2026. URA publishes no count of resale units listed for sale; that absence is stated in the text rather than filled with a portal estimate.
- Unsold units and take-up by district: our own computation, aggregating URA’s monthly developer-sales record for the latest published month across every project still selling. District names follow URA’s own postal-district convention.
Where our numbers are soft
- “No active launch” is not “no unsold homes”. The developer-sales record covers projects with sales activity in the published month. A sold-out project, or one that has not launched, does not appear. The five districts named have no project in that file — a narrower claim than having no unsold stock.
- Per cent sold is cumulative, not a rate. The file carries no launch date, so a long-selling project and a new one are not distinguishable in it. This is a limitation of the public data, not of the arithmetic, and it is why we quote unsold counts rather than ranking districts by absorption speed.
- New sales only. Resale listings are excluded throughout. In older districts they are the larger part of what a buyer competes with.
- One month. The district split is the latest published month. A single large launch can move a district materially between reports.
- The 34,000 is two different things added together. We have kept them separate in the text because the distinction is the article, but the headline figure circulating elsewhere generally does not.
- The two-building comparison is an illustration, not a finding. Two projects cannot establish or refute a benchmark effect, which is the section’s own point. Their medians are twelve-month figures over 22 and 24 resales respectively — small samples where one unusual unit moves the number — and neither is adjusted for floor level, condition or stack. We name them because a worked example teaches the mechanism better than an abstraction, not because either is a good or bad building.
- Districts, not homes. Everything else here compares places. It says nothing about a specific project, stack, floor or lease, and it is not a valuation of anything.
A note on what this is not. We are not recommending or discouraging any district, project or development, and nothing here is a view on whether property should be part of anyone’s plan. Districts are named because that is how the data is published. Individual developments are named where they are the factual example under discussion — the comparison in this piece exists to show that a two-building gap cannot be read as a verdict on either building, which is the opposite of a recommendation. We build a free Singapore property decision tool, sell no property, mortgages or advice, carry no advertising, and earn nothing from any link on this page.
General information and education only. This is not financial advice and takes no account of your objectives, situation or needs. Property is illiquid, its transaction costs are large, and published supply figures are revised. Check current figures at their primary source before relying on anything here.