If you have spent an evening watching Singapore property videos, you have heard both of these said with total confidence.
“Good resale beats new launch. Always.”
“New launch is the sure win. That is where the money is made.”
They cannot both be right. And yet both sides can point at real transaction data, from the same public source. Neither is making anything up.
The same study, three answers
The most thorough public attempt at this question — Stacked Homes, “Are New Launches A ‘Sure Win’?” — matched 152,948 pairs of transactions, the same unit bought and later sold, identified by address including the unit number, out of more than 450,000 URA records going back to 1995. That is far better than the two-projects-side-by-side comparisons the genre usually runs on.
Pick a measurement window. Watch the answer change.
152,948 matched pairs of transactions, the same unit bought and later sold. Totals are Stacked Homes’ computation (Sean Goh, 12 May 2021); the per-year figures are ours.
The study publishes no holding period for this window, so it cannot be put on an annual basis at all — by us or by anyone.
Try the other two windows.
| Window | Launch, total | Resale, total | Launch, per yr | Resale, per yr |
|---|---|---|---|---|
| 1 Jan 1995 – 31 Mar 2021 | 27.1% | 34.7% | 2.83% | 5.18% |
| 14 Jan 2011 – 31 Mar 2021 | 7.9% | 6.9% | 1.20% | 1.16% |
| 1 Jan 2015 – 31 Mar 2021 | 11.8% | 10.6% | not published | not published |
Quote the first window and resale wins. Quote either of the others and new launch wins.
The per-year columns matter more than they look. Launch buyers in that study held for about 8.6 years; resale buyers held 5.9. So the published totals are not like-for-like — one side had years longer to earn its gain.
Put both on the same annual basis and the second window’s famous “new launch wins” nearly vanishes. The lead works out at four hundredths of a percentage point a year, which is a number nobody can feel, so here it is in money instead. On a S$1.5 million home held six years, the entire advantage is about S$3,800. The buyer’s stamp duty on that same purchase is S$44,600.
The tax is twelve times the whole thing. That is the margin half the internet is arguing about.
The third window cannot be annualised at all, because no holding period was published for it.
Why the window decides it
Here is the part that is easy to miss. Those three windows are not three different periods. They all end on the same day — 31 March 2021.
Every one of those windows ends on the same day
They are not three different periods. They differ only in how far back they reach — and that alone flips the answer.
Reach back to 1995 and resale wins clearly. Start in 2011 and new launch “wins” by a margin worth less than a tenth of the stamp duty on the purchase. Start in 2015 and nobody can say.
Nobody has to be lying. Two Singapore rules put the two groups on different parts of the market cycle: Seller’s Stamp Duty penalises an early exit, and a new launch is not a building yet.
In plain English: this is not a race. It is two runners who started at different times, on different parts of the track, and an argument about who is faster.
And the rule that sets the minimum holding period changed twice. For purchases between 14 January 2011 and 10 March 2017 the lock ran four years, topping out at 16%. From 11 March 2017 to 3 July 2025 it was three years and 12%. On and after 4 July 2025 it is back to four years and 16% (IRAS).
Look at what that does to the middle row. The window labelled “since SSD began” runs from January 2011 to March 2021 — so it contains two different SSDs, switching about six years in. Buyers who faced a four-year lock are averaged with buyers who faced three, as though they made the same decision.
We got this wrong ourselves
So we ran it on our own data. The first result came back beautifully: launch buyers underperformed by 4.04% a year across twenty-four projects, only 8.3% of them positive. Consistent sign, tight spread, segments in a sensible order. It agreed with what we already half-believed.
It was wrong.
Our data started in late 2021, and the code treated each project’s first visible sale as its launch. But several of those projects launched in 2018 and 2019 and were merely still selling their last units. We had recorded late-phase prices — higher, because developers raise prices as a project sells through — as launch prices, then measured how badly those buyers did. The window had manufactured the entire result.
So we tightened the rule: count a project only if we had actually seen it launch, and if somebody had since resold a unit in it. Of 184 projects, not one qualified. Almost none has had a resale yet — a launch takes years to build, then four more before the stamp-duty lock lifts, and five years of data cannot span that.
We could not answer the question either. We are telling you because that first result — clean, confident and wrong — is exactly the sort of thing that gets screenshotted and repeated for years.
We are not debunking anyone. Over the longest window published, resale did come out ahead. But the gap is small, it reverses with the window, and it excludes the costs that would decide it. Anyone who says this is settled has skipped a step — including anyone who says it is settled in resale’s favour.
So ask a question that has an answer
Knowing the evidence cannot settle it is worth something. It is not much help on a Saturday afternoon in a showflat.
The useful move is to notice that for most buyers this was never mainly a returns question. Four things genuinely separate a new launch from a resale, and every one is knowable today.
You cannot move in. A new launch is a floor plan and a showflat. A resale is a home you can stand in, in the light it actually gets, next to the neighbours you will actually have. And you do not need an industry average for the wait: your sale and purchase agreement names a Vacant Possession Date, and clause 13.4 makes the developer liable for liquidated damages if it slips. Use yours, not an average of other people’s contracts.
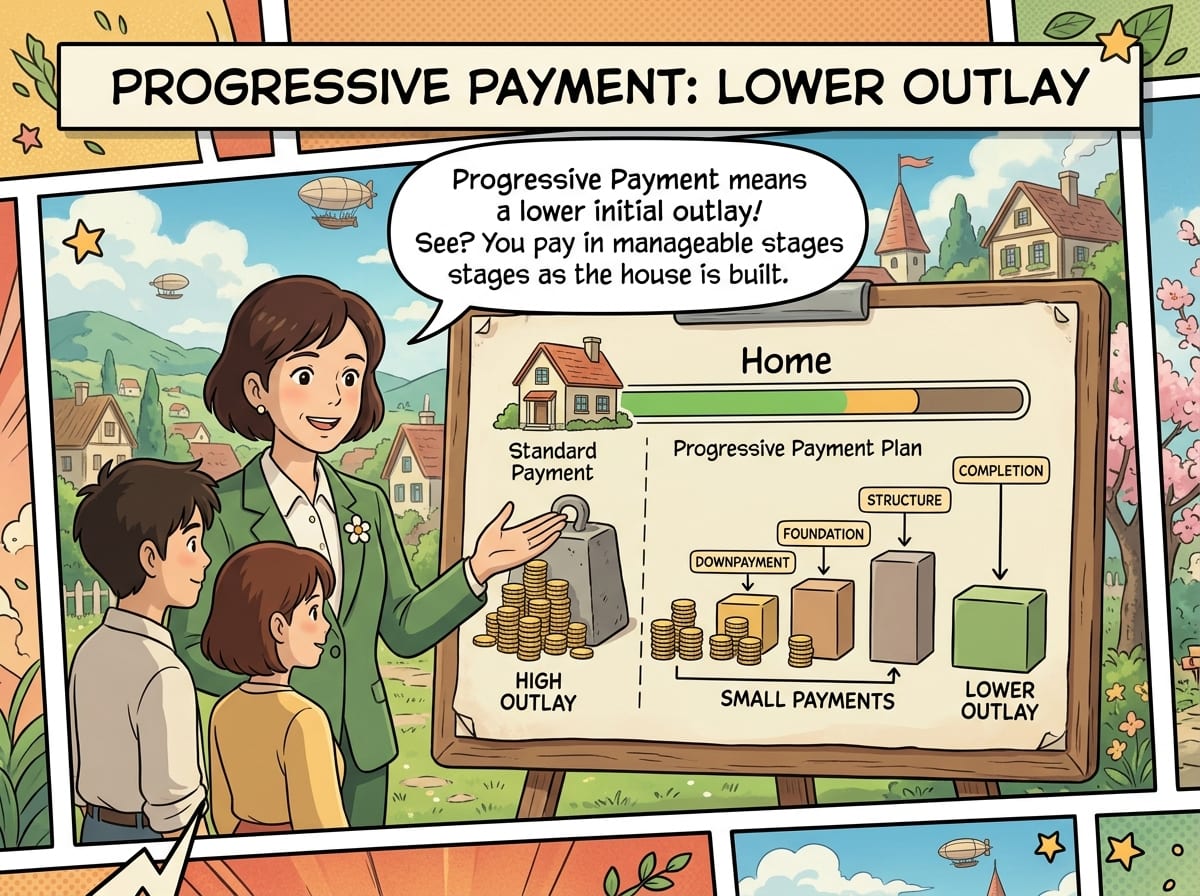
You pay for two homes while you wait. This is left out of every comparison, including the studies — and the schedule is not the developer’s choice. It is set in law, in the sale and purchase agreement prescribed by the Housing Developers Rules (First Schedule, clause 5.1):
- 20% on signing, within eight weeks of the option — inclusive of the booking fee, not on top of it
- 10% when the foundation and pile caps are done
- 10% at the reinforced concrete framework
- 5% each at partition walls, roofing, wiring and plumbing, and the car park, roads and drains
That is 60% of the price before the building is finished. The 25% at Temporary Occupation Permit takes you to 85% paid on the day you get the keys — and every instalment before it is owed on somewhere you cannot live, while you are also paying to live somewhere else.
The lock starts before the home does. Seller’s Stamp Duty runs four years from the day you buy, not from the day you collect keys. On a new launch, most of that lock is served while you do not yet have the property. Your exit clock and your occupation clock are not the same clock.
And the gap buys floor area. Which is the one number we can put on it.
What the gap costs you, on your own budget
What the same budget reaches, new versus existing
New-build homes cost more per square foot than existing ones nearby. This is what that difference costs you in floor area, on a budget you choose. Computed by us from URA transaction records.
Square feet, at each segment’s own resale median. The gap is not a measure of overpaying — it is measured against every existing home in the district, including stock built thirty years ago, so part of it buys a genuinely newer building. What it does tell you is what the same money reaches.
| Segment | New costs more per sq ft | Resale median $psf | Comparisons |
|---|---|---|---|
| Outside Central | +52.0% | $1,872 | 405 |
| Rest of Central | +46.9% | $2,362 | 483 |
| Core Central | +42.2% | $2,756 | 293 |
Sources, both ours, and not the same measure: the gap is the median of new-sale $psf against the resale median in the same district and quarter, within size band and tenure class — 1,373 quarterly comparisons, 2021Q3–2026Q3. The resale median $psf is each segment’s own 12-month median across all sizes and tenures. Applying one to the other shows the scale of the difference; it is not a valuation of any particular unit. Both from URA caveat data.
Whether that trade is worth it depends on something this article cannot know: whether you are buying somewhere to live or somewhere to let. For an owner-occupier those square feet are the point. For an investor they are inventory.
Worth noticing too that the core-central gap is more than double the outside-central one. Land cost, scarce new supply and where the state has been selling sites are all plausible explanations. We have not tested any of them.
We have tested whether the gap is moving, though, and it is. Outside central it has widened sharply, from about 39% in 2021 to about 56% in 2025. The core central region has barely moved at all — 43% then, 43% now. The rest of central sits between them, drifting from 42% to 47%.
So the premium for buying new is diverging, not converging. In 2021 the three segments sat within about four percentage points of one another; by 2024 they were twenty-six apart, and in 2025 still thirteen. And the spread is being opened from the suburbs upward rather than from the centre downward, which is the reverse of the story usually told about Singapore’s prime districts.
What to take from this

Two things, and neither requires you to become a data analyst.
First, when someone shows you a property comparison, ask three questions. Over what window — if they cannot give you start and end dates, the number means nothing, and this one question retires most of what you will be shown. How many transactions — two projects side by side is an anecdote, however confident the delivery. And were the holding periods matched — if one side held eight years and the other six, the comparison is measuring time as much as strategy.
Second, and more usefully: stop trying to settle the returns argument. It has swallowed the entire conversation and it cannot be won on the evidence that exists. Work the four differences instead — when you need to move in, what you would pay to live somewhere else while you wait, when your exit clock actually starts, and what the entry gap costs you in floor area. Those have answers, and the answers are yours rather than the market’s.
We cannot tell you whether new or resale wins, and on the published evidence nobody else can either. But that was probably never the question worth asking.
Sources, and where our numbers are soft
Sources
- Sean Goh, “Are New Launches A ‘Sure Win’? We Analyse 450,000 Property Transactions”, Stacked Homes, 12 May 2021. Every total-gain and holding-period figure attributed to the study is theirs; the annualised figures are ours, computed from their published averages.
- Housing Developers Rules, First Schedule — the prescribed sale and purchase agreement. The payment schedule is clause 5.1; the liquidated-damages provision for a missed Vacant Possession Date is clause 13.4.
- Seller’s Stamp Duty for residential property and Buyer’s Stamp Duty, IRAS. The S$44,600 figure is exact for a S$1.5m residential purchase under the rates effective 15 February 2023.
- URA private residential transaction data, via the URA Data Service. The entry-gap figures, the segment resale medians and the voided 4.04% result are our own computation from caveat data; our method is published, including the run we discarded.
Where our numbers are soft
-
The transaction data is incomplete by design. URA’s records come from lodged caveats, and not every sale produces one, so a missing transaction can quietly break an ownership chain.
-
Checking it costs money. Following one unit from purchase to resale needs address-level detail. The free public feed carries no unit numbers — we hit exactly that wall. URA’s REALIS, which does carry them, is S$1,960 a year for one account under the fees effective 1 January 2024.
-
The S$3,800 is an illustration, and the assumptions are ours. It compounds our annualised figures for the 2011–2021 window (1.20% against 1.16% a year) over six years, roughly the resale holding period in that study, on a S$1.5m purchase. Change the horizon or the price and it moves; the point is the order of magnitude, not the fourth digit.
-
The annualised columns are an approximation. They compound an average gain over an average holding period, taken from the study’s published aggregates. That is not the same as the mean of per-transaction annual returns, and we could not compute the latter without the underlying data.
-
The study excludes the costs that would decide it — stamp duties, agent commissions and renovation — and its resale figures exclude rental income. It is also five years old; its most recent window ends March 2021.
-
Corrected 9 August 2026, and the conclusion changed. This piece originally reported the entry gap as 34% to 83% and said the premium was converging across segments — 63 percentage points apart in 2021, 34 by 2025. Both were wrong. Our comparator pool was keyed on a district field that URA carries on the transaction rather than on the project, so every district merged into a single national pool, which inflated the core-central figure and deflated the suburban one. Re-run correctly the gap is 42% to 52%, the segment order reverses, and the spread widens from about 4 points in 2021 to about 13 in 2025. The corrected record sets out the fault, the fix and the regression test. It was our error, and our own follow-up study found it.
-
Floor area is not measured the same way on both sides. URA harmonised the floor-area definitions for development applications submitted from 1 June 2023, and one change was that voids are excluded from strata area. A new unit with double-volume space therefore reports a smaller area than the identical unit would have before, which raises its price per square foot without raising its price. Both sides here are strata figures, so the effect is second-order and confined to unit types with voids, but it runs in the direction of overstating the new-build premium rather than understating it. We have not tried to quantify it: identifying which units carry voids needs plans, not caveat data.
-
The entry gap combines two of our own measures, and they are not the same measure. The gap is a like-for-like comparison within district, quarter, size band and tenure; the segment median $psf is a broad 12-month aggregate. Applying one to the other shows the scale of the difference, not the value of any particular unit.
-
The payment schedule is statutory, not conventional. The commonly repeated version of it says “brick walls”; the rule says partition walls, and the 20% first instalment is inclusive of the booking fee rather than on top of it.
-
There is no standard construction period. The Vacant Possession Date is a blank in the agreement, filled in per project. Any “new launches take X years” figure is an average of other people’s contracts, not a fact about yours.
A note on what this is not. We are not telling you to buy or avoid anything, and we take no view on any particular project, district or developer. We name one publication because we rely on its data and you should be able to check it — its work on this question is the best available, which is precisely why it is worth reading carefully. We build a free Singapore property decision tool, sell no property, mortgages or advice, carry no advertising, and earn nothing from any link on this page.
General information and education only. This is not financial advice and takes no account of your objectives, situation or needs. Property is illiquid and its transaction costs are large. Past transaction patterns describe the past. Check current rules and your own contract before relying on anything here.