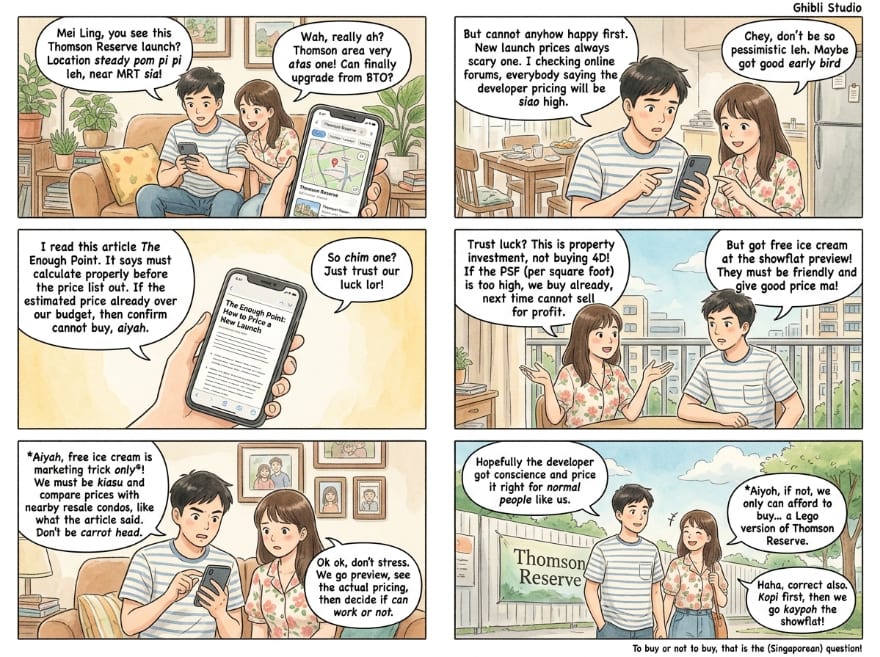
Thomson Reserve — the redevelopment of the former Thomson View, on Bright Hill Drive in District 20 — is due to preview in October. If you are planning to go, that is the first time you will see the price — in a sales gallery, on a day when bookings are being taken and units are being chosen off a chart on the wall.
Almost everything else is already knowable, today, from data that is free and public.
This piece works out the lot: what you would need to earn to clear the loan, what the land cost and what that implies, how far above the neighbourhood each size of unit would sit, what the same money buys in an existing block two streets away, and how fast District 20 has to rise for you to get your money back. None of it needs the price list. All of it changes what the price list means when you see it.
What this is not. It is not a view on whether to buy, there is no price target in it, and it does not tell you the project is good or bad value — nobody can say that before a price exists, and we would not say it after. It is the arithmetic, done in advance, with every source named so you can check it and re-run it on the real numbers in October.
If you read nothing else
- The gate comes before the price. A 950 sq ft unit at S$2,900 psf needs about S$799,000 of cash and CPF and roughly S$17,900 a month in household income — tested at a 4% floor, not the 1.5% you will be quoted. Turning 42 rather than 35 adds 16% to that income bar.
- Ask the price of the size you want, not the project. On one price list the gap over nearby resale runs +18% to +78% depending purely on unit size. The project does not have one premium.
- Know your hurdle before you walk in. District 20’s young stock has to be 27% to 52% dearer — depending on what you pay — before you sell at your own entry price. Hold past about fifteen years and you are selling alongside older, cheaper stock, so the hurdle rises.
- In October, bring three numbers: the psf for your stack, the size band it falls in, and what the same money buys resale two streets away. Everything below is how to work them out.
First gate: could you carry it at all?
Most buyers meet this wall before they meet any valuation question, and it is worth meeting it at your kitchen table rather than in the sales gallery.
Two rules do the work. Banks must test your instalment at a 4% interest floor even though packages are currently quoted nearer 1.5%, and your total debt payments cannot exceed 55% of gross monthly income. And to borrow the full 75%, the loan must run no more than 30 years and finish by the time you are 65.
Here is what that means at three unit sizes, priced at S$2,900 per square foot. As a first-property buyer there is no Additional Buyer’s Stamp Duty, so the upfront bill is the 25% you cannot borrow, plus Buyer’s Stamp Duty, plus roughly S$3,000 of legal fees.
Where S$2,900 comes from, since it is doing a lot of work. It is not a guess and not anyone’s quote. The land cost is known: S$1,178 per square foot per plot ratio, verified at the marketing agent’s own award announcement.
Two sections down we check that against eight recent sites where the winning bidder’s registered entity matches the developer now selling on the land. Those pairs sell at 2.1 to 2.8 times their land rate, which on S$1,178 implies roughly S$2,500 to S$3,300. S$2,900 sits inside that, a little above the middle.
It is a working figure for showing you the shape of the arithmetic — not a prediction of what October will say. Re-run every table below on the real number.
| Unit | Price | Cash + CPF | Loan | Income needed |
|---|---|---|---|---|
| 650 sq ft | S$1,885,000 | S$538,100 | S$1,413,750 | S$12,300 / month |
| 950 sq ft | S$2,755,000 | S$799,100 | S$2,066,250 | S$17,900 / month |
| 1,250 sq ft | S$3,625,000 | S$1,066,350 | S$2,718,750 | S$23,600 / month |
On a phone this table scrolls sideways — the loan and income columns are to the right.
Income assumes a 30-year loan, the 4% floor, and no other debt at all — every dollar of car or study loan raises it. At S$2,600 per square foot, subtract roughly 10%; at S$3,100, add about 7%.
Then the age clause, which catches people out. To get the full 75% the loan must finish by 65, so a buyer of 42 is capped at 23 years rather than 30. On the 950 sq ft unit above, that lifts the income requirement from S$17,900 to about S$20,800 — a 16% jump for the same home, caused by nothing except a birthday. Worth checking before you fall in love with a floor plan.
Three rows and one price cannot be your situation, so here is the same arithmetic with the inputs handed over. Move the price, the size, your age and whether this would be your first property, and watch what each does. The shaded band on the price slider is the range those eight land-and-launch pairs imply, so you can see how far any number you are quoted sits from it.
Run it on your own numbers
Every input below moves the answer, and one of them is your age. Nothing is saved and nothing is sent anywhere — the arithmetic runs in your browser.
Shaded: S$2,500–3,300, what the eight land-and-launch pairs above imply on this site’s verified land cost. Tick: their median, S$2,722. A derived range, not a forecast and not anyone’s quote.
Computed in your browser from published rules: 55% Total Debt Servicing Ratio tested at the 4% medium-term floor, 75% loan-to-value available only where the loan runs no more than 30 years and ends by age 65, Buyer’s Stamp Duty at the rates effective 15 February 2023 and Additional Buyer’s Stamp Duty at those effective 27 April 2023 (MAS and IRAS). Income assumes no other debt at all; every dollar of car or study loan raises it. The cash line is the 5% minimum deposit that CPF cannot cover, plus any Additional Buyer’s Stamp Duty, which falls due within 14 days of signing and cannot be borrowed; the rest of the downpayment may come from CPF subject to your own balances and the usual limits. The 1.6% package rate is a curated current-market figure with no public feed — indicative only, and it changes nothing about whether you qualify, because the bank tests you at 4% regardless. Resale medians and the S$2,165 exit comparable are our own computation from URA records, twelve months to August 2026. Legal fees are a conventional S$3,000 allowance, not a quote. This is an illustration of published rules, not advice, not a valuation and not a forecast — and clearing these gates is not the same question as whether a purchase is wise.
Two things tend to surprise people on first use. Age moves the income requirement harder than most price changes do, because it shortens the loan rather than shrinking it. And the second-property line, when you switch it on, is usually larger than every other number on the screen — which is the next section.
Second gate: is this your first property?
If it is not, stop and re-run everything, because this single line is larger than every other number on this page.
A Singapore citizen buying a second residential property pays 20% Additional Buyer’s Stamp Duty on top of the ordinary duty. On the 950 sq ft unit at S$2,900 that is S$551,000, due within 14 days of signing, payable in cash, and not borrowable. Your upfront goes from about S$799,000 to about S$1,350,000.
For permanent residents the second-property rate is 30%. For foreigners it is 60% on any purchase.
It also moves the finish line, not just the start: you would need roughly another 20% of price appreciation simply to recover the duty. Anyone in this position is really asking a different question — whether to sell first and buy after — which carries its own timing risk and is worth an hour with a banker rather than a paragraph here.
Is the price they quote a sane one?
You can check this before the price appears, because the land is already public.
The former Thomson View was awarded on 25 November 2024 at S$810 million to a consortium of UOL Group, Singapore Land and CapitaLand Development — about five hectares at a plot ratio of 2.1. The marketing agent’s announcement puts it at S$1,178 per square foot per plot ratio, and states the figure is reached after factoring in land betterment charges and the lease upgrading premium for a fresh 99-year lease.
Read that clause twice, because it is the trap. Do the division yourself and S$810 million across roughly 1.13 million square feet of sellable space is nearer S$714. The distance between S$714 and S$1,178 is the two payments to the state — for building more on the site, and for resetting a lease that began in 1975. Close to two-fifths of what the land cost sits in charges the headline sale price never mentions. So the question to ask anyone quoting a land rate is: before or after the charges? Quoted before, the developer looks like it paid far less than it did, and every sum you build on top comes out wrong in their favour.
Against URA’s record of awarded tenders, S$1,178 is genuinely below current land: awards in 2026 have averaged S$1,474 per square foot per plot ratio, up 17% on 2025’s S$1,260, with Lentor Central at S$1,278 in March and Bayshore Drive at S$1,323 in July. One correction to the usual telling, though — this was not land bought long ago and patiently held. It was awarded in late 2024, roughly a year before the tenders it is compared against.
Now turn land into a price. The familiar rule of thumb says launch price is about 1.8 to 2.0 times the land rate. We checked it and it is out of date — our own property tool has been quoting it, and we are fixing that. Joining URA’s awarded-tender record to its monthly developer-sales record wherever the winning tenderer’s registered entity matches the published developer gives eight land-and-launch pairs:
| Site | Land $psf ppr | Project | Sold $psf | Mult. |
|---|---|---|---|---|
| Orchard Boulevard | 1,617 | Upperhouse at Orchard Boulevard | 3,437 | 2.13× |
| Pine Grove (Parcel B) | 1,223 | Nava Grove | 2,686 | 2.20× |
| Bukit Timah Link | 1,343 | 8@BT | 3,017 | 2.25× |
| Champions Way | 904 | Norwood Grand | 2,072 | 2.29× |
| Zion Road (Parcel B) | 1,304 | Promenade Peak | 3,037 | 2.33× |
| River Valley Green (Parcel A) | 1,325 | River Green | 3,111 | 2.35× |
| De Souza Avenue | 841 | The Sen | 2,341 | 2.78× |
| Zion Road (Parcel A) | 1,202 | Zyon Grand | 3,400 | 2.83× |
The multiple runs 2.13× to 2.83×, median 2.31× — not one is near the old rule. Applied to a verified S$1,178, land like this has been converting into roughly S$2,500 to S$3,300 per square foot, with the middle of the pairs near S$2,700.
Treat that as a sanity check and nothing more. The multiple is not a developer’s margin: it carries however much the whole market moved in the 24 to 44 months between land purchase and launch, and construction costs have risen too. It also predicts nothing about whether buyers agree — the two highest in that table are 90% and 38% sold.
One more thing about that column, and it is the reason the pairs are not simply averaged. A land rate in S$ psf ppr is priced on gross floor area; a launch price in S$ psf is charged on strata area, the space you actually own. Those two are not a fixed ratio, because URA harmonised the floor-area definitions for development applications submitted from 1 June 2023: strata areas including air-conditioner ledges now count towards GFA, so the same GFA entitlement yields less to sell, which pushes the multiple up for reasons that have nothing to do with the market. Here it happens not to matter much — seven of the eight sites were awarded after that date, and so was Thomson View, so the comparison is already close to like for like. On post-harmonisation pairs alone the median is 2.33× rather than 2.31×, about 1% on the implied price. On an older site it would matter a great deal more.
And it is not a precise number. URA publishes a developer-sales median per month, so that column is each project’s June 2026 median — the price its buyers actually paid, which URA records at the Option to Purchase, but resting on just 24 transactions across all eight sites, from six down to one apiece. Run the identical method on May instead and the median multiple is 2.46×, not 2.31×, because two pairs moved about 0.3× on a handful of sales. On this land cost that is the difference between a middle estimate of S$2,700 and one of S$2,900. The range is informative; the third significant figure is not.
For the rest of this piece we need prices to work with. We use S$2,600, S$2,900 and S$3,100 per square foot, chosen to straddle what those pairs imply. They are ours, they are not a quote from anyone and not a forecast, and every table below re-runs on whatever October actually says.
How far above the neighbourhood would you be paying?
District 20 — Bishan and Ang Mo Kio — is a liquid resale market: 363 condominium resales in the twelve months to August 2026, at a median of S$1,961 per square foot.
New homes always cost more per square foot than existing ones, and a district median mixes every vintage and stack at once. The comparison sharpens when you match on size, because size drives price per square foot more than the postcode does.
Find your size band:
The gap is a spread, and unit size decides where you sit in it
How far above District 20 resale of the same size each unit would be priced, across the three illustrative prices. Bar runs from S$2,600 to S$3,100 per square foot; the notch is S$2,900.
- Under 600 sq ftresale median S$1,965 psf+32–58%
- 600 – 850 sq ftresale median S$2,199 psf+18–41%
- 850 – 1,150 sq ftresale median S$2,042 psf+27–52%
- 1,150 sq ft and overresale median S$1,739 psf+50–78%
Same building, same price list, same morning — and the gap over the surrounding market runs from +18% to +78% depending only on which door you walk through. The 600–850 band is the tightest priced against its local comparison; the largest units are the most stretched, partly because the big-unit band in this district is weighted towards much older stock, which drags that comparison down and overstates the gap at the top end.
Computed by us from URA resale transactions, District 20, twelve months to August 2026 —345 sales in total, split into the four size bands our pipeline uses. Each band shown carries at least fifteen transactions; below that we suppress the percentiles rather than publish a thin median. This is not a measure of overpaying. A district median mixes every vintage, floor, stack and condition, so part of any gap buys a genuinely newer building, a warranty and no near-term repair bill — and the prices are our own illustration, not a price list.
Is that gap unusual? Our own study of 483 new sales across the rest-of-central region put the typical new-launch entry gap at a median +46.9% over the contemporaneous district resale median — so on that benchmark this range is ordinary.
But that benchmark is not matched on lease, and it matters more than it sounds. It compares new units against all resale in the district, most of which has decades less lease to run, so part of the 46.9% is simply the difference between a fresh 99 years and a used one. We have now run that comparison properly. Restrict the resale side to leasehold with 85 or more years remaining and the gap falls to +30.2% — and, strikingly, to almost exactly the same figure in every market segment: 31.8% in the core central region, 30.3% outside central. So a fresh lease is worth real money. But how much of the gap it explains is a harder question than the two figures make it look, and we got it wrong at first: the buildings that survive an 85-year filter are not the same buildings, so part of that fall is which homes are left in the comparison rather than the lease itself. Measured on identical homes — same project, same quarter, same size band, same district on both sides — the lease accounts for about 4 percentage points of the rest-of-central gap, and about 12 outside central. Real, and a good deal smaller than the headline subtraction suggests.
Two things follow. The first is that anyone quoting you a single “new launches cost X% more” figure has almost certainly not told you which resale they measured it against, and the answer moves by a third. The second is a limit on our own number: stock with 85 years left is also newer and better specified, so matching on lease partly matches on the newness being priced. That bounds the blend rather than separating it — the true premium for newness is no larger than about 30%, not equal to it. The full record is filed, pre-registration and all.
The same money, in square feet
A percentage is hard to feel. Here is the identical fact in the unit you actually live in.
What S$2.4m buys, building by building
The same sum spent at each building’s own median resale price per square foot, District 20, twelve months to August 2026. The top row is that sum at S$2,900 per square foot — an illustrative new-build price, not a quote from anyone.
- Thomson Reservenot built · at S$2,900 psf, our illustrationour illustrative price828—
- Jadescape91 yrs lease · 327m to Marymount · 64 resales91 yrs · 327m1,025+24%
- Sky Vue86 yrs lease · 208m to Bishan · 16 resales86 yrs · 208m1,085usually to 807+31%
- Thomson Three85 yrs lease · 194m to Upper Thomson · 22 resales85 yrs · 194m1,110+34%
- Thomson Impressions88 yrs lease · 358m to Bright Hill · 15 resales88 yrs · 358m1,118+35%
- The Panorama86 yrs lease · 351m to Mayflower · 31 resales86 yrs · 351m1,150usually to 1,141+39%
- Centro Residences80 yrs lease · 143m to Ang Mo Kio · 25 resales80 yrs · 143m1,186+43%
- Thomson Grand83 yrs lease · 298m to Bright Hill · 16 resales83 yrs · 298m1,319+59%
- The Gardens At Bishan70 yrs lease · 246m to Bright Hill · 16 resales70 yrs · 246m1,327usually to 1,227+60%
- Braddell View54 yrs lease · 377m to Caldecott · 25 resales54 yrs · 377m2,279usually to 1,701+175%
Each bar is how much space S$2.4m buys at that building’s own median price per square foot. Nothing is capped: if the money reaches a bigger home there, the bar shows it.
The upright mark on each bar is the 90th percentile of sizes that actually trade in that building — nine in ten of its resales were smaller than that. It is not the largest unit there; it is where the top tenth begins. On 4 of them the bar runs past that mark, and how far past is the whole point — at Braddell View the budget implies 2,279 sq ft against a usual ceiling of 1,701, while at The Panorama it clears the mark by 9 sq ft, which is no gap at all. Read the wide ones as optimistic for two reasons. You may not find a home that size. And a building’s median price per square foot is set by the sizes it actually sells, so applying a small-unit building’s rate to a large notional home overstates the space: bigger homes almost always trade at a lower rate per square foot than smaller ones in the same block.
Against 828 sq ft in a building that does not exist yet, the range runs from 24% more to more than double. The extra space is not money saved: part of what you pay for a new build is the building being new — a fresh 99-year lease, and nothing to repair for years. The lease column is where the biggest jumps show their price: the row with the most space has 54 years left, against a fresh 99.
Computed by us from URA private resale transactions, District 20, twelve months to August 2026; walking distances are straight-line to the nearest station entrance, so a real walk is typically 20–40% further. Two filters, applied mechanically: within 400 m of an MRT entrance, and at least 10 resales in the period so no median rests on one unusual unit — which is why some nearby blocks are absent: Sky Habitat, for one, recorded nine. Where a bar is capped, the ceiling is the 90th percentile of sizes that traded, not the largest unit the building contains; the feed publishes what sold, not what exists. A median mixes floor, stack, condition and renovation, so no row is a price for any particular unit, and no row is a view on any building.
That is the trade, stated plainly: about 828 square feet finished some years from now, or roughly 1,000 to 1,300 square feet you could move into next month — one to two extra bedrooms, within a few hundred metres of the same stations, with eighty to ninety years of lease still to run.
Those five are the ones the budget reaches. Three of them are worth putting side by side properly, because they are the buildings this one will most resemble once it is finished: District 20, modern leasehold with 85 or more years left, at least ten resales in the year. Taking the three most-traded of that set gives Jadescape, The Panorama and Thomson Three — chosen by that rule, not by us, and you can swap in any of the other 309.
Compare three, on the public record
318 condominiums, 26 districts, twelve months to August 2026.
Every measure, side by side
Computed by us from URA private resale transactions and LTA station-exit locations, twelve months to August 2026. A project appears only if at least 10 units resold in that period — 318 of about 1,135 condominiums clear that, so this is the liquid end of the market, not a full list. Every price is a median of what traded, mixing floor, stack, facing, condition and renovation, so it is not a valuation of any particular unit. Distances are straight-line to the nearest station entrance; a real walk is typically 20–40% further. “Against its district” compares a project with resale of the same size band in the same district. Buildings are labelled by postal district, which is exact; we do not show a market-segment tag, because the upstream classification is an approximation and disagrees with itself inside some districts. There is no overall score and there will not be one: the weights belong to whoever is buying.
Thomson Reserve is carried as a fourth column, and it is deliberately not scored against the other three. Look at how little is in it. Two cells are facts you can check today — the lease is a fresh 99 years, and the station is about 180 metres away. One is our illustration, not a price. The rest do not exist yet, because nothing has been resold, so there is no record to compare. That empty column is the honest heart of this article: what you are accepting when you buy off a floor plan is not a worse building, but a building with no record, priced against buildings that have one.
Its one derived figure is worth reading carefully. At S$2,900 per square foot it sits 32% to 67% above resale in the same district — a range, not a number, because the gap depends entirely on what size they build, and the size mix is exactly what the October price list will tell you first.
And the wait is currently unquantified. The developer’s own listing gives expected completion as to be announced. If you would be renting through it, District 20 rents imply about S$5,100 a month on a 1,100 square foot unit — roughly S$245,000 over four years. If you would be living with family or already own where you live, ignore that entirely; it only bites if there is rent in the gap. The instalments during construction are not the developer’s choice either, and we have worked that comparison out in full: does progressive payment really cost less?
What the newness actually buys — and it is not nothing
Everything above makes the gap sound like a cost. Some of it buys real things, and the same neighbourhood prices them for you.
The fresh 99-year lease is worth money. Within 400 metres of a station in District 20, Jadescape at 91 years remaining resells at a median S$2,341 per square foot over 64 sales; Braddell View at 54 years resells at S$1,053 over 25 sales. Roughly half. That is an association rather than a decay curve — those buildings differ in age, quality and location as well as lease — but a lease under 60 years does start to restrict how much CPF can be used and how willingly banks lend. A fresh 99 buys the top of that ladder and a long runway before any of it matters.
Size brings liquidity, and liquidity holds price. The marketing agent’s award announcement put the site at up to 1,240 homes; the marketing pack says 1,268. Either way it would be the largest single building in the district by some distance. All of District 20 traded 363 resale condominiums last year, and the most liquid single building in it is Jadescape at 64 sales — which is also the priciest per square foot in the table above, and that is not a coincidence. A building that always has buyers is a building you can leave when you need to.
Nothing needs replacing, and for a year it is not your problem. A resale flat carries whatever the previous owner deferred. A new one carries a statutory defects liability period — twelve months from the day you are given vacant possession, during which the developer must make good any defect at its own cost. If it does not, you can rectify the defect yourself and have the Singapore Academy of Law withhold the cost from the stakeholder sum it holds. That is small money against the entry gap, but it is a genuine transfer of risk, and it lands in the years when your cash is thinnest.
You choose the unit, and on these spreads that is worth more than choosing the building. Inside a single one of the buildings compared above, eight in ten resales run 16% to 30% apart between cheapest and dearest — floor, stack and facing doing all of that work, in the same block, on the same lease. At a launch you pick off the whole chart on the wall. In resale you take what happens to be listed that month. The gap between two units in one building is routinely wider than the gap between two buildings, and only one of those is something you get to decide.
The location facts are durable, and they are checkable without trusting a brochure. The government’s own OneMap records the site at 1 Bright Hill Drive. Measured from there in a straight line:
| Straight-line distance | |
|---|---|
| Upper Thomson MRT (TE8), exit 1 | about 180 m |
| Ai Tong School | about 510 m |
| Bright Hill MRT (TE7), exit 1 | about 890 m |
Two things worth noting, because both get muddled in the coverage. The near station is Upper Thomson, not Bright Hill — the address says Bright Hill Drive, which invites the opposite assumption. And Ai Tong School sits comfortably inside the one-kilometre priority ring for primary-one registration, which is a real and durable advantage for a family, though the ring is measured by the school’s own rules rather than by our line on a map. The Thomson-East Coast line runs from that station to Orchard and the city without a change, and the nature reserve to the west cannot be built on. None of that depends on anybody’s price list.
What the neighbourhood is doing while you decide
Three things bear on how plausible that rise is, and all three are public today.
The segment is currently the weakest of the three. Singapore splits into three price regions and District 20 sits in the middle one. In URA’s second-quarter 2026 statistics, overall private home prices rose 0.5% — but prime central rose 1.8%, suburban fell 0.1%, and the rest-of-central region where this sits fell 1.2%. It is the weakest of the three, and it is the one you would be buying.
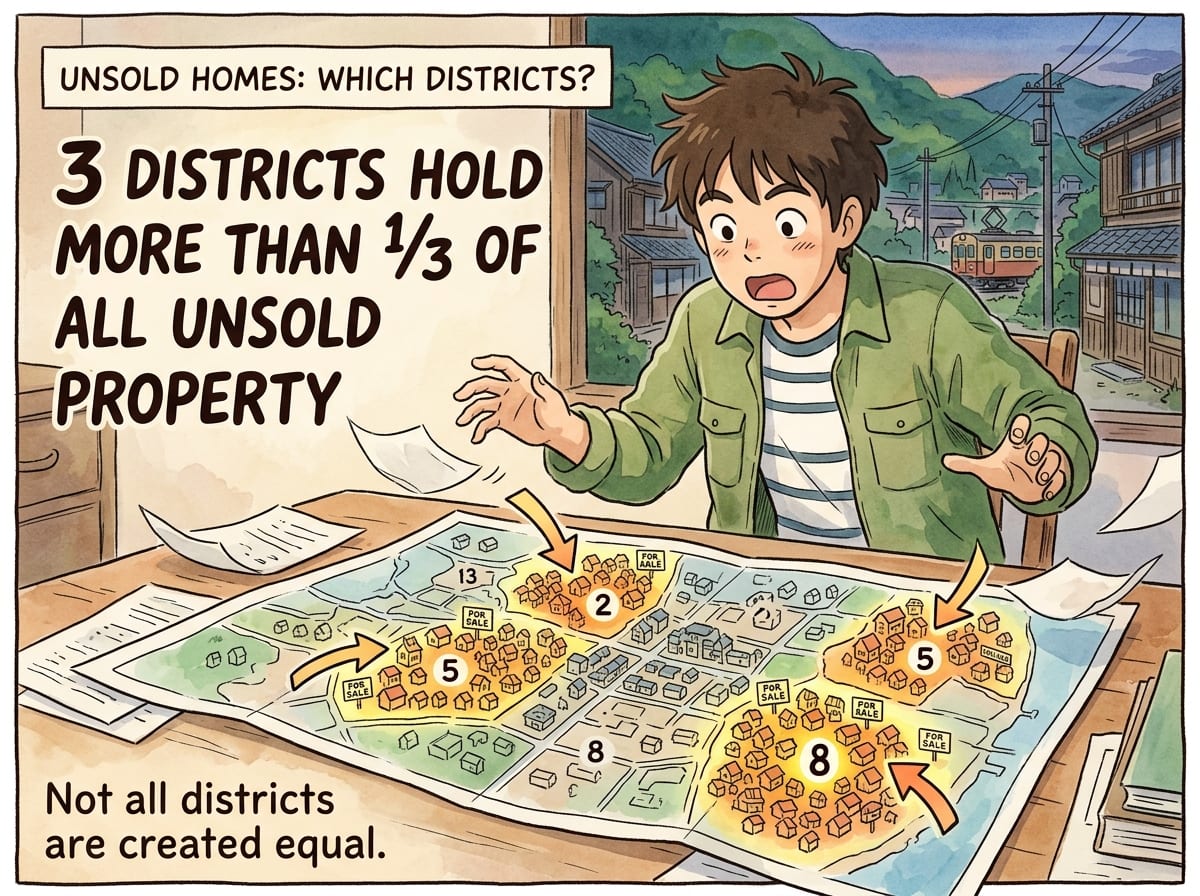
A lot of national supply — but read where it is. Roughly 34,000 unsold new private homes nationally sounds like a headwind. On the local evidence that would be the wrong read: the unsold stock is concentrated in a handful of districts, and District 20 is one of five with no active launch in the latest monthly file at all, while the Upper Thomson corridor next door has been clearing almost everything it opens. The supply risk here is later rather than now — this building’s own 1,200-odd homes eventually reaching resale together.
It does not pay for itself as a rental. District 20 rents support a gross yield of about 2.8% on today’s resale prices. Buy at S$2,900 per square foot and the same rent is 1.9% — around 2.2% if you allow a generous new-build rent premium. Mortgage packages are currently 1.3% to 1.7%. Before maintenance, property tax and any empty month you are roughly break-even; after them you are paying to hold it. That matters if the plan ever quietly becomes “rent it out for a while”.
The number that decides it
Set aside whether the price is fair. The answerable question is narrower: what does the neighbourhood have to do for you to get your money back?
Your exit comparable already exists. In about nine years this would be a four-to-five-year-old condominium in District 20 with roughly ninety years of lease left. Five buildings fit that description today — those with 85 or more years remaining and at least ten resales in the period: Jadescape, Thomson Impressions, Sky Vue, The Panorama and Thomson Three. Their median resale price is S$2,162 per square foot.
So: starting from S$2,162, how far must District 20 rise for you to sell at your own entry price after roughly 6% of round-trip costs — stamp duty going in, agent commission coming out?
| Annual rate, if you sell after | |||||
|---|---|---|---|---|---|
| If you pay | District 20 must rise | 7yrs | 9yrs | 12yrs | 15yrs |
| S$2,600psf | +27% | 3.5% | 2.7% | 2.0% | 1.6% |
| S$2,900psf | +42% | 5.2% | 4.0% | 3.0% | 2.4% |
| S$3,100psf | +52% | 6.2% | 4.8% | 3.6% | 2.8% |
This assumes it ends up an ordinary building in its own neighbourhood. The exit base is S$2,162, the middle of 5 District 20 blocks with 85+ years of lease and at least 10 resales. If it settles at the dearest of them (Jadescape, S$2,341) the middle row needs +31% instead of +42%; at the cheapest (The Panorama, S$2,087) it needs +47%. Where it lands in that cohort is worth roughly four times the choice of average, which moves it only +38% to +42% (median of their medians S$2,162 · mean of them S$2,190 · weighted by resale count S$2,228). Five buildings is a thin set, and the median of five is really one of them.
Read the bold column first. Pay S$2,900 and the neighbourhood has to be 42% dearer than it is today before you get your money back. That figure assumes nothing about how long you hold. It does assume one thing, and it is the fair objection to make: that the building ends up an ordinary member of its own neighbourhood rather than the best address in it. If it settles where Jadescape sits today — the dearest of the five, and the newest — the same S$2,900 needs +31%, not +42%. That single question is worth more than every other uncertainty in this table combined, and no one can settle it from a floor plan.
The annual rates are the same fact wearing a horizon, and they move a long way: 5.2% a year if you sell after seven, 2.4% if you can wait fifteen. Nothing about the building changes between those two numbers — only the hold does. An earlier version of this table showed the nine-year column alone, which quietly made an unmeasurable assumption look like the finding.
One thing does change across those columns, and the table cannot show it. The five buildings above were selected at 85 or more years of lease. Sell after seven years and this one still has about 91 left, so it is squarely among them. Wait fifteen and it has about 83 — it has aged out of its own comparator, and the stock it now sells alongside is cheaper. The long horizons are measured against a cohort the building has left, which makes the fifteen-year hurdle the most flattering column in the table rather than the safest.
For scale — and this matters more than it looks — there is no single long-run rate to measure it against. URA’s index has compounded at 1.8% a year over thirty years, 4.7% over twenty, 2.8% over fifteen, 4.6% over ten and 6.1% over five. Whoever picks the window picks the answer, which is exactly the trap that makes the new-launch-versus-resale argument unwinnable — and it applies to the hurdle just as much as to the history, which is why the table above gives you four horizons instead of choosing one for you. Nearer at hand, the District 20 resale median sits 4.6% above where it sat over the preceding twelve months — a median of what traded, so a shift in which units sold moves it too.
The point is not which of those is right. It is that at the bottom of a price band the market can disappoint and you are still whole, and at the top it must gain half its value again before you are level, and on a seven-year hold that means beating almost every window in its own history with nothing to spare. Same building, same view, same school — the risk is set by the number on the list.
Is a hurdle that size unusual? Not at present
The arithmetic is not special to this project, and you can run it on anything already selling. Take Zyon Grand, on the Zion Road parcel in the land table above. The units it sold in June 2026 went at a median of S$3,400 per square foot. Match District 3 resale the same way we matched District 20 — 85 or more years of lease, ten or more resales — and you get eleven buildings on 388 sales with a median of S$2,252. That is +60% before its buyers are level, or 5.4% a year over nine.
Read that as context, not a league table. Different districts have different resale bases, different rents and different reasons to be dear, and nothing here says one project is a better buy than another. Two narrower points survive the comparison. A hurdle in the forties or fifties is simply what buying new costs in this market, so a large number is not by itself a red flag. And 90% of Zyon Grand has sold at that price — buyers are clearing hurdles of this size today, which tells you about demand and nothing at all about recovery.
The same caveat applies as to the land table, and harder. S$3,400 is one month’s median on five units, at the tail of a project that is 90% sold. In May the same figure was S$3,361.
What sells last is not a random sample of a project. High floors, the odd stack, the units nobody wanted at launch — that is what the tail is made of, so a monthly median drifting upward at 90% sold is at least as likely to be which units happened to sell as it is to be price. The comparison table above shows the scale of that: inside a single building, eight in ten resales span 16% to 30% between cheapest and dearest. Four sales cannot locate a project inside a spread that wide, in either direction.
Two consequences, and they cut opposite ways. Nobody should read S$3,400 as what a Zyon Grand unit is now worth — there is no resale market yet, and this is developer stock, not a valuation. And nobody who bought earlier at a lower figure should read the gap as a gain. The sensitivity is real though: a buyer who got in at S$3,100 rather than S$3,400 faces +46% instead of +60%. Which is the point of the whole exercise — the building does not change, the entry price does.
Whether that number is high depends on you, not on the building
There is no price list yet, so nothing here can be called good or bad value, and we are not going to pretend otherwise. But the arithmetic does resolve into something more useful than a verdict: at any given price, four things about you decide whether the hurdle is easy or brutal. None of them is a fact about the building.
How long you would hold. This one does more work than everything else combined. At S$2,900, a seven-year hold needs 5.2% a year — a rate cleared by exactly one of the five windows URA’s own index has produced. A fifteen-year hold needs 2.4%, cleared by four of the five. Same building, same price, same morning. The difference is entirely how long you stay.
Whether you pay rent while it is built. Worked in full in the companion piece: paying rent through construction leaves you about S$132,034 worse than buying resale, and paying none leaves you about S$44,266 better. The sign flips. If you would be living with family or already own where you live, most of the cost of waiting is not yours to pay.
Whether this is your first property. Additional Buyer’s Stamp Duty of S$551,000 on the worked unit, in cash, within fourteen days. That is not a headwind; it is a different question, and it has its own answer.
Whether you would live in it. At S$2,900 the rent supports about 1.9% against 2.8% on today’s resale, and mortgage packages run 1.3% to 1.7%. Before maintenance, tax and an empty month you are roughly level; after them you are paying to hold it. As a home that is a cost you chose. As an investment it is a different proposition, and the yield says so.
Work out which of those four are true for you before October, because the price list will not tell you and nobody in the room will ask.
What to do in October, and it is all free
Six things, in the order you would actually do them. Screenshot this and take it with you.
- At home
- Test it at 4%, not the gallery’s rate.Check the age-65 clause too — calculator above. If it fails here, stop.
- If you already own a home, check the duty first.Additional Buyer’s Stamp Duty on a 950 sq ft unit at S$2,900 is S$551,000 — cash, within 14 days, not borrowable. For many people the answer stops here.
- Write down the price that would be too high.Entry × 1.06 ÷ S$2,162 is how far District 20 must rise to break even. Settle it in your kitchen.
- In the room
- Get the completion date in writing.If you would be renting through it, each extra year costs about S$61,000. Your agreement names a Vacant Possession Date — use yours, not an average.
- Ask the price for your size, not the average.A 700 and a 1,300 sq ft flat compete with different homes nearby.
- Then
- Compare it with your number.Above it, the building is fine and the price is not.
Do those six and you walk in with everything the room cannot tell you already settled — which leaves the only part that was ever yours: how long you would actually live there, how much cushion you want, and whether the trade between space now and newness later is one you want to make. That is a decision, not a calculation, and it is not ours to make.
Sources, and where our numbers are soft
Sources
-
Collective sale price, award date, site area, plot ratio, the S$1,178 psf ppr land rate and its stated inclusion of land betterment charges and lease upgrading premium: Edmund Tie & Company, sole marketing agent for the collective sale, award announcement of 25 November 2024, which also states a yield of up to 1,240 homes. The consortium composition is confirmed in CapitaLand Development’s own newsroom release.
-
Awarded land tenders, prices and the 2026 and 2025 averages: URA, Past Sale Sites, residential awards, read 8 August 2026.
-
Median new-sale price per square foot, units launched and units sold for every project still selling, and unsold stock by district: URA’s monthly developer-sales record, latest published month.
-
Private residential price index and quarterly movement by market segment: URA via data.gov.sg, series to the second quarter of 2026. The five long-run compound rates are computed from the full history back to 1975.
-
Resale medians, size-band percentiles, lease remaining, gross rental yields, transaction counts and distance to the nearest MRT entrance: our own computation from URA private transaction and rental records and LTA station-exit locations, twelve months to August 2026.
-
Buyer’s Stamp Duty and Additional Buyer’s Stamp Duty, IRAS, at the rates effective 27 April 2023. Loan rules — 55% Total Debt Servicing Ratio at the 4% medium-term floor, 75% loan-to-value, the 30-year and age-65 caps: MAS.
-
The defects liability period and the remedy if a developer does not act: Housing Developers (Control and Licensing) Rules, Schedule (the prescribed sale and purchase agreement) — Singapore Statutes Online. Twelve months from the delivery of vacant possession, or the fifteenth day after the purchaser receives the specified documents, whichever is earlier.
-
The eight land-and-launch pairs, the method used to match them and the full workings: our filed record of the re-derivation, 8 August 2026. It sets out the entity-matching rule, the coverage (fifty projects currently selling, of which forty-two sit on collective-sale land or older awards and cannot be paired), every pair with its award date and take-up, the deflation to each site’s own award quarter, and the checks that stop a bad match reaching the page — including the 2010 award that a naive version of this join wrongly paired at 6.37×.
Where our numbers are soft
-
Zyon Grand is named as a worked example of the method, not as a comparison of merit. Its S$3,400 is URA’s published developer-sales median for June 2026 and its take-up is from the same record. We hold no view on it, and the piece contains no view on which project anyone should prefer.
-
Corrected twice on 9 August 2026. We first cited the entry-gap study at +62.1% for the rest-of-central region. That study’s comparator pool turned out to be keyed on a district field that URA carries on the transaction, not on the project, so every district merged into one national pool. Re-run correctly the figure is +46.9%, and the lease-matched figure quoted above did not exist when this was published. The corrected record explains the fault in full; it was our error, found by our own follow-up study. We then overstated how much of the gap the lease explains — “roughly a third” — by differencing two figures computed on different sets of homes. Holding the homes fixed puts it nearer a tenth in the rest of central. Both corrections came from running our own caveats down rather than from anyone complaining.
-
The three illustrative prices are ours. S$2,600, S$2,900 and S$3,100 were chosen to straddle what the observed land multiples imply on this land cost. They are not a quote, a forecast or a valuation, and no marketing price list is reproduced anywhere here. Re-run every table on the real list.
-
The three sizes in the affordability table are ours too, chosen to sit one in each of our data’s size bands rather than taken from anyone’s published mix. Yours will be whatever is on the floor plan. The S$3,000 of legal fees is a conventional allowance, not a quote.
-
Gross floor area is not strata area, and the definition moved. The land side of the multiple is priced on GFA, the launch side on strata area. URA’s harmonisation applies to development applications submitted from 1 June 2023, and we classify each pair by its award date, which is only a proxy — a site awarded earlier could have submitted its application later and fall under the new rules. Seven of eight are post-harmonisation on that proxy, as is Thomson View, so the effect here is about 1% on the median. We have not attempted to quantify the strata-to-GFA shift itself, which cannot be measured from free public data.
-
The land multiple is eight pairs, and thinner than it looks. All state land sales, all awarded 2022 to 2024, and the launch side is each project’s current median transacted price rather than its launch-day price — specifically, URA’s median for a single month, which across the eight rests on 24 transactions in total. Recomputing on the previous month moves the median multiple from 2.31× to 2.46×. Both sides of the Thomson Reserve comparison are today’s prices, so the comparison is like for like, but the ratio should not be read as a margin. It also embeds market movement between award and today. Restating every pair at the price index of its own award quarter pulls the median from 2.31× to 2.11× — still nowhere near the old rule. A single flat haircut using the 6.5% two-year index move gives about 2.16×, but that understates the older sites: the 2022 award in the table saw the index move 16.3%, not 6.5%.
-
The S$714 figure is our arithmetic, not the agent’s. It divides S$810 million by site area times plot ratio. Gross floor area definitions vary at the margin, so treat it as approximate; the direction is the point.
-
The hold period is an assumption. How far the district must rise follows from the entry price, the exit comparable and the 6% round trip alone — but the exit comparable is itself a choice, and a hold long enough to age the building out of that five-building cohort changes which stock the comparison is against. An earlier version of this note called the hurdle assumption-free. It is not: it is free of an assumption about the rate of appreciation, not about what you sell alongside. Only the annualised columns depend on a hold, which is why four are shown. Whether the premium fades, and how fast, cannot be measured on free public data — the address-level records that could answer it cost S$1,960 a year. The 6% round trip covers stamp duty in and agent commission out; it excludes legal fees, renovation, maintenance and property tax.
-
Medians hide units. A district median mixes vintage, floor, stack, condition and renovation. It is the right benchmark for “how far above the neighbourhood is this” and the wrong one for “is this particular unit worth it”. Size-band medians rest on subsets of those 363 resales; our pipeline suppresses a band below fifteen transactions, so each band shown clears that, but none is large.
-
The premium does fade, and since publishing this we have measured it. Across 37,722 resales in 25 districts, a condominium’s price against its own district-quarter-size-band cell runs about +10% at six to ten years old, flat from eleven to twenty, and −12% by twenty-one to thirty, reaching the district’s mixed-age level at about nineteen years. That is the evidence behind quoting the hurdle against young stock, and behind the fifteen-year caveat above. Three things it is not. It is not a smooth slide — the eleven-to-fifteen and sixteen-to-twenty buckets are indistinguishable, so the pre-registered prediction of a monotone decline was wrong and is recorded as such. It is not one building followed through time; a five-year window cannot do that. And it is the combined effect of lease run-down, wear and changing fashion, which this cannot separate. Design, guards and the failed prediction.
-
The five-building comparison still mixes more than lease. Those buildings differ in quality, finish and location as well as age, and the decay curve above is a national average that does not tell you where any one of them sits.
-
Rent and yield are district figures applied to a home of equal value, and mortgage package rates of 1.3–1.7% are broker-quoted promotions with no public feed. Treat both as indicative.
-
A collective sale is not a state tender. It is priced in a private negotiation against a reserve rather than a sealed bid, which is one more reason the multiple is a check and not a valuation.
A note on what this is not. We are not recommending or discouraging this project, this district, this developer or property in general, and nothing here is a view on whether anyone should buy. There is no price target and no forecast: the illustrative prices are our own and labelled as such, and the break-even table is a hurdle rate, not a prediction. The project is named because a buyer deciding in October needs the arithmetic for the building they are actually looking at, and abstractions do not help them — every figure carries its source and its sample size, and the piece stops where the judgement starts. We build a free Singapore property decision tool, sell no property, mortgages or advice, carry no advertising, and earn nothing from any link on this page. That tool has been quoting the stale 1.8–2.0 land rule described above. It is now corrected, and the re-derivation is filed in full, including what the new figure is not.
General information and education only. This is not financial, mortgage or tax advice and takes no account of your objectives, situation or needs. Property is illiquid and its transaction costs are large. Cooling measures, stamp duties and lending rules change without notice — confirm anything load-bearing with a banker or mortgage broker, and check current figures at their primary source, before relying on anything here.