There is a rule of thumb everybody in Singapore property repeats: the suburbs pay you rent, the prime districts pay you prestige. Buy in Woodlands and the yield is generous. Buy in Orchard and you are paying for the postcode.
It is a tidy story, and the property internet states it as fact. We checked it against 26 of the country’s 28 private districts — every one with enough resale activity to measure. It is not there.
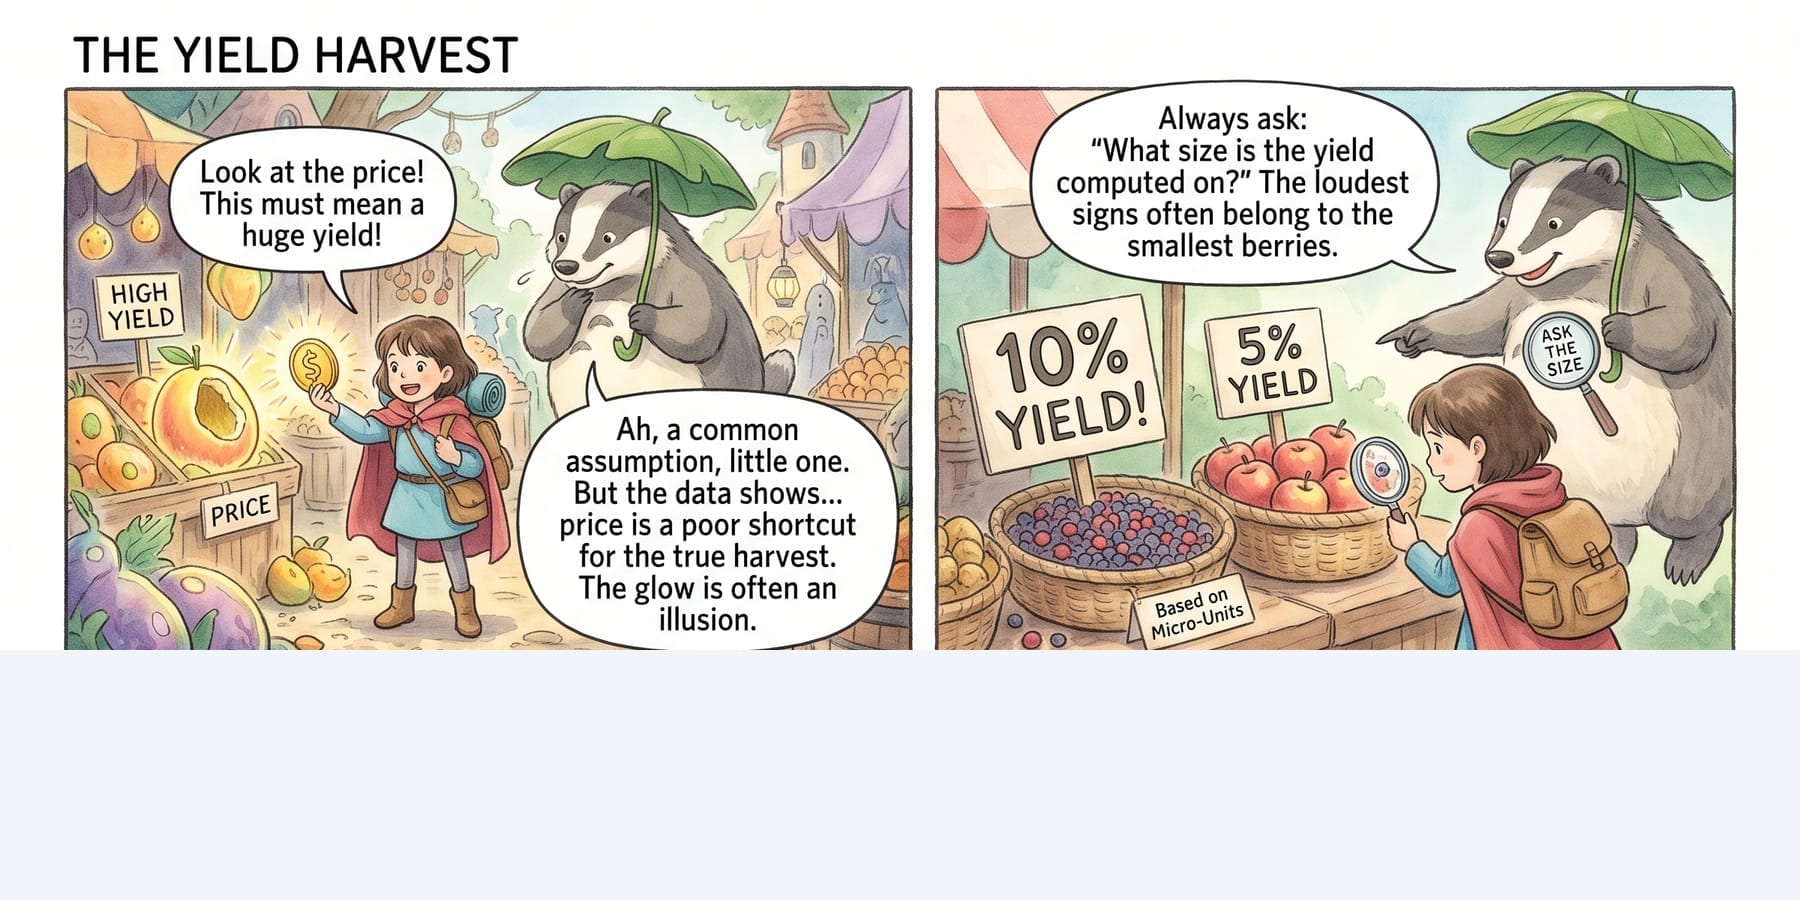
Price does not predict yield. Unit size does.
Every private district, plotted twice. On the left, the relationship everyone assumes. On the right, the one that is actually there. resale condominiums and apartments, last 12 months, URA caveat data, as at July 2026.
- Price
- Gross yield
- Median size
- Resales, 12m
Split the districts in half by price and the two halves yield almost the same: 3.45% against 3.36%. Split them by the size of the flats instead and the gap is nearly four times wider. Districts of small flats yield more; districts of family-sized homes yield less — which is most of what a district-level yield is actually measuring. Yield is gross, before maintenance, tax and vacancy.
| District | Segment | Median $psf | Gross yield | Median size | Resales, 12m |
|---|---|---|---|---|---|
| D25 Woodlands / Kranji | OCR | $1,153 | 3.89% | 935 sqft | 92 |
| D17 Changi / Loyang | OCR | $1,255 | 3.37% | 1,026 sqft | 261 |
| D27 Sembawang / Yishun | OCR | $1,301 | 3.77% | 1,031 sqft | 296 |
| D23 Bukit Batok / Choa Chu Kang | OCR | $1,490 | 3.26% | 1,029 sqft | 614 |
| D18 Tampines / Pasir Ris | OCR | $1,492 | 3.45% | 981 sqft | 756 |
| D26 Upper Thomson / Mandai | OCR | $1,502 | 2.95% | 1,191 sqft | 76 |
| D16 Bedok / Upper East Coast | OCR | $1,526 | 3.33% | 1,083 sqft | 572 |
| D28 Seletar / Yio Chu Kang | OCR | $1,548 | 3.19% | 920 sqft | 218 |
| D22 Jurong | OCR | $1,614 | 3.52% | 1,086 sqft | 272 |
| D19 Serangoon / Hougang / Punggol | OCR | $1,691 | 3.28% | 915 sqft | 1,308 |
| D14 Geylang / Eunos | RCR | $1,697 | 3.83% | 875 sqft | 622 |
| D12 Balestier / Toa Payoh | RCR | $1,741 | 3.45% | 923 sqft | 359 |
| D8 Little India / Farrer Park | RCR | $1,765 | 3.83% | 923 sqft | 173 |
| D4 Sentosa / Harbourfront | RCR | $1,774 | 3.68% | 1,675 sqft | 258 |
| D21 Upper Bukit Timah / Clementi Pk | RCR | $1,805 | 2.66% | 1,206 sqft | 421 |
| D15 East Coast / Marine Parade | RCR | $1,833 | 3.03% | 1,259 sqft | 947 |
| D5 Buona Vista / Clementi / Dover | OCR | $1,873 | 3.57% | 967 sqft | 772 |
| D1 Raffles Place / Marina | CCR | $1,959 | 4.08% | 941 sqft | 157 |
| D20 Bishan / Ang Mo Kio | RCR | $1,962 | 2.84% | 1,134 sqft | 376 |
| D13 Macpherson / Potong Pasir | RCR | $1,992 | 3.43% | 808 sqft | 302 |
| D11 Novena / Newton | CCR | $2,049 | 2.83% | 1,322 sqft | 338 |
| D7 Bugis / Beach Road | RCR | $2,126 | 4.06% | 904 sqft | 121 |
| D2 Tanjong Pagar / Anson | CCR | $2,162 | 3.91% | 731 sqft | 132 |
| D10 Bukit Timah / Holland | CCR | $2,239 | 2.80% | 1,561 sqft | 836 |
| D3 Tiong Bahru / Queenstown | RCR | $2,250 | 3.49% | 863 sqft | 550 |
| D9 Orchard / River Valley | CCR | $2,330 | 3.09% | 1,263 sqft | 679 |
Median resale price and transaction counts computed by us from URA caveat data, resale condominiums and apartments, last 12 months, URA caveat data. Gross yield is the district's median resale rent over its median resale price, unadjusted for unit size — small units rent for more per square foot, so a district holding more of them will show a higher yield for that reason alone. That is the main caveat on any district-level yield, including this one. Districts 6 and 24 are absent because too few private resales occur there to give a meaningful median.
The relationship everyone assumes is missing
Look at the left panel. If price predicted yield, those points would slope from top-left to bottom-right. They do not.
Put a number on it the simplest way there is. Sort the districts by price, cut the list in half, and compare the two halves. The thirteen cheapest yield 3.45% on average. The thirteen dearest yield 3.36%. A tenth of a percentage point apart — which is to say, the same.
It does not hold at the extremes either, which is where a weak rule usually survives. The average district yields 3.41%. Of the two cheapest districts, one sits above that and one below. Of the two dearest, the same. A coin flip at both ends.
The middle is no better, and the middle is where most people are shopping. Between roughly $1,500 and $2,100 per square foot — 16 of the 26 districts — yields run from 2.66% to 4.08%. That is the entire national range inside one price band.
The one that is there
Now the right panel. Same 26 districts, same yields, but sorted by the size of the typical flat instead of its price.
Do the same split. The thirteen districts with the smallest flats yield 3.58%. The thirteen with the largest yield 3.23%. That gap is nearly four times the one price produced — and unlike the price split, it holds steadily down the ranking rather than appearing only at the ends.
It is not an enormous difference in absolute terms. On a S$1.5 million home it is roughly S$5,000 a year in gross rent. But it is a real one, and it is the one that is actually there. The mechanism is not mysterious — rent per square foot falls more slowly than price per square foot as flats get bigger. A studio does not rent for half what a two-bedroom does simply because it has half the floor area. So the smaller the unit, the more rent each dollar of price buys.
That resolves the oddity sitting at the top of the yield table. The highest-yielding district in Singapore is in the city centre, which the folk model says should be impossible. Its median flat is 941 square feet. The next two on the yield table have median flats of 904 and 731 square feet, yielding 4.06% and 3.91%. Meanwhile the lowest-yielding district in the country has a median flat of 1,206 square feet, and the next-lowest 1,561.
Prime or suburban turns out to be almost beside the point. What is built there is not.
What that means for a yield figure
A district-level yield is mostly a statement about the housing stock, not about the location. When somewhere is described as a high-yield district, the usable translation is: that district contains a lot of small apartments.
That is not a criticism of small apartments, and it is not a reason to buy or avoid one. But it does mean two yields are only comparable when they describe the same kind of home. Comparing a shoebox district against a family-housing district and concluding that one location is a better investment is comparing unit sizes and calling it geography.
The question that makes any yield figure usable is the one almost nobody asks: what size is this computed on?
And all of these are gross. Maintenance, property tax and the months a place sits empty come out before anything reaches you.
What to take from this
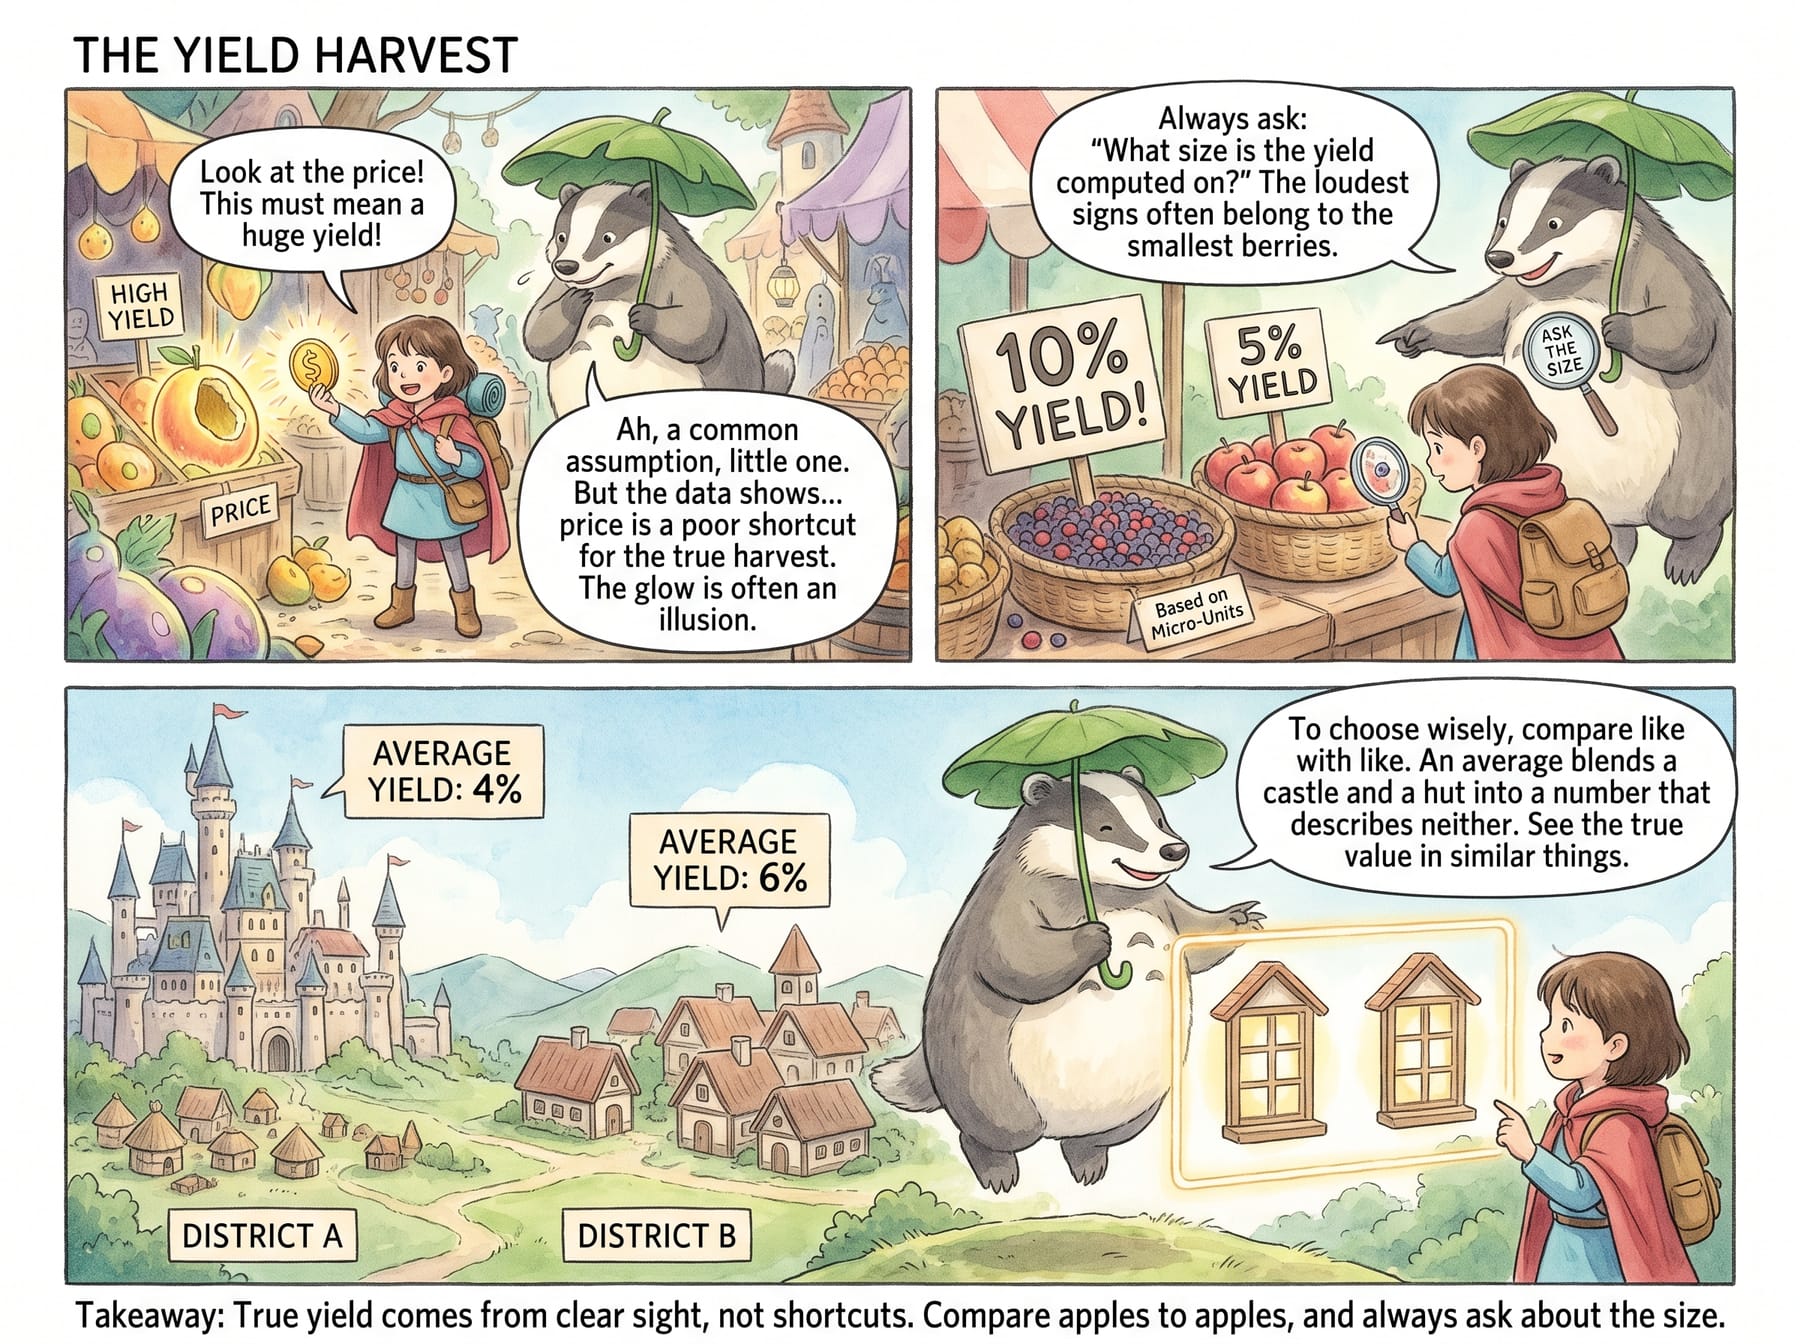
Do not use price as a shortcut for yield. It is the assumption embedded in most property conversation and it does not survive contact with the data.
Ask what size the yield is computed on. This single question does more work than any district ranking. A project or an agent quoting a headline yield is usually quoting the smallest units in it.
Compare like with like. If you are choosing between two districts, compare the same number of bedrooms in each. A district average blends a studio and a four-bedroom into one number that describes neither.
Sources, and where our numbers are soft
Sources
- URA private residential transaction and rental data, via the URA Data Service. Median resale price per square foot, transaction counts, median unit sizes and gross yields are our own computation from caveat data, covering the twelve months to July 2026.
- Segment classifications (core central, rest of central, outside central) follow URA’s own definitions.
Where our numbers are soft
- For readers who want the correlations. Rank correlation (Spearman) between price and yield is −0.09; between median unit size and yield, −0.59. On raw values they are −0.14 and −0.53. The article quotes half-and-half averages instead, because a correlation coefficient is not a unit most people carry around — and the split says the same thing in figures you can check by eye against the table.
- With 26 observations, this establishes the presence of one relationship, not the absence of the other. A modest price effect could hide in a sample this small. What can be said is that size is much the stronger of the two.
- Unit size is a volume-weighted mean of project medians, not a true district median, and it excludes one corrupt record — a project carrying a 626,545 sq ft “unit size”, which is a land figure rather than a flat. Left in, it moved its district’s mean by a factor of five.
- Gross, not net. Before maintenance, property tax, agent fees and vacancy.
- Medians hide dispersion. A district median says nothing about a particular project, floor, lease or condition. This compares places, not homes.
- Districts 6 and 24 are absent because too few private resales occur there to produce a meaningful median.
- A snapshot, not a trend. Twelve months to July 2026. Yields move with both rents and prices, and those have not been moving together.
- Size is not the only thing left uncontrolled. Lease type, building age and condition all bear on yield, and none is held constant here.
A note on what this is not. We are not recommending any district, and nothing here is a view on whether property should be part of anyone’s plan. Districts are named because that is how the data is published. We build a free Singapore property decision tool, sell no property, mortgages or advice, carry no advertising, and earn nothing from any link on this page.
General information and education only. This is not financial advice and takes no account of your objectives, situation or needs. Rental yields vary with the individual property and change over time, property is illiquid, and its transaction costs are large. Check current figures before relying on anything here.