On 27 May 2026, Korea did something no market had done before: it listed leveraged funds on single stocks. Two, specifically — Samsung Electronics and SK Hynix, the only names large enough to qualify. Each promised twice the daily move.
Korean savers understood the appeal immediately. Within about a fortnight the money in these products roughly doubled, from around US$3 billion at listing to close to US$9 billion. Roughly 92% of the buying was retail. Not institutions. People.
Then the memory trade turned. Both stocks fell more than 20% from their late-June highs inside about a week — a bear market in seven trading days, while Samsung was still reporting record profits.
Here is what that did to the money.
S$10,000 in SK Hynix, on the day it peaked
22 June to 31 July 2026. The shares in Seoul against CSOP’s 2× fund on them in Hong Kong — which any Singapore brokerage can reach.
At the low on 30 July the shares were worth S$4,529 and the 2× fund S$1,351. The stock halved. The fund lost 86%.
SK Hynix shares peaked on 22 June. Five weeks later a holder was down 55% at the low. Someone who bought the 2× fund on the same stock, on the same day, was down 86% — S$10,000 reduced to S$1,351. The shareholder kept 45 cents in the dollar. The fund holder kept 14.
The regulator’s response was to triple the minimum deposit required to buy these products, from ₩10 million to ₩30 million, and the head of the financial supervisor publicly regretted how quickly they had been approved.
That is the story most people now have about leveraged funds. It is true, and it is half the picture. The other half is stranger, and more useful.
First, what the ride actually looks like
The best leveraged fund of the last decade was the 3× semiconductor one: 65.9% a year for ten years. It also fell 90% at its worst, between December 2021 and October 2022 — about ten months. Put that in a statement rather than a percentage: S$50,000 became S$4,770, while everyone around you explained why semiconductors were finished. That 65.9% belonged only to whoever sat through that screen — and through five other falls of more than half, across the same sixteen years.
That is the mismatch. Nobody buys a 2× fund on Samsung expecting to watch it halve while being right about Samsung. The damage happens in the gap between those two expectations — not in the arithmetic, but in the entirely human decision to sell at the bottom of a fall that was never in the plan.
A stop-loss makes this worse, not better. A level rarely touched on the ordinary stock gets hit routinely on a 2× version of it. You are sold out of a position that later recovers — right about the company, stopped out anyway.
Right about Nvidia, and still down
The 2× fund in that opening chart is not the Korean one. It is run by CSOP, listed in Hong Kong, holds about US$5.5 billion, and most Singapore brokers can reach it. You did not need a Korean account to lose that money.
But the clearest warning in CSOP’s range is not a memory stock at all.
Right about Nvidia. Still down.
Every trading day of 2026 to 30 June. Nvidia shares against the 2× fund on them, both starting at zero.
No crash and no drama — the stock simply rose, unevenly. The fund was up 39% in May and finished below where it started. Twice the stock’s return would have been +14.8%. You were right about the most discussed company on earth, you held the product built to double it, and you finished behind.
Traded prices, rebased, because that is the daily series available publicly. Note that net asset value is the fairer comparison against a share price: it strips out whatever premium or discount the fund happens to trade at, which has nothing to do with the daily reset. On that basis CSOP reports −0.49% for the same period, against −5.06% at the traded price. The line above therefore flatters the stock a little — but on either basis the fund finished below zero while the stock finished up 7.4%.
Nobody holds a chart, they hold a position. In May this one was up nearly 40%, which is a gain with a decision attached. By 30 June there was nothing left to decide.
The issuer is admirably direct about why. From CSOP’s own key facts statement:
“This product is not intended for holding longer than one day… it is even possible that the Product will lose money over time while the Underlying Stock’s performance increases or is flat.”
And on cost, where the Hong Kong disclosure is far blunter than anything American issuers print: CSOP discloses swap and option costs of up to 40% a year of net assets on the SK Hynix product, and up to 35.2% on the Samsung one. Read that as a disclosed ceiling rather than this year’s bill — what you actually pay depends on how expensive it is to borrow the stock, and on a volatile single name that is not a small number. Before the market does anything at all.
And yet, on other markets, it worked
None of that makes these products a trap. Look at the same structure elsewhere.
Same structure, same decade, opposite outcomes
What a holder of each 3× fund ended with after ten years, as a multiple of what someone who simply owned the index ended with. Compounded from each issuer’s published annual average returns to 30 June 2026 — the figures in the table below.
Three beat their index handsomely. Two ended with less than an index holder had — and they are the two whose markets spent the decade churning rather than climbing.
| Average return per year, 10 years to 30 Jun 2026 | The 3× fund | Its index |
|---|---|---|
| SOXL — 3× semiconductors | 65.9% | 36.6% |
| TQQQ — 3× Nasdaq-100 | 45.5% | 22.1% |
| UPRO — 3× S&P 500 | 29.7% | 15.3% |
| TNA — 3× small caps | 9.6% | 11.5% |
| KORU — 3× Korea | 14.4% | 16.7% |
A holder of the 3× semiconductor fund ended the decade with roughly seven times what an ordinary semiconductor fund holder had. The 3× Nasdaq fund averaged 45.5% a year. These are not near-misses, and anyone who tells you these products are simply a scam has not looked at them.
On other markets the same design did the opposite: 3× small caps and 3× Korea both left their holders with less than the plain index over the same period.
It cuts both ways inside a single year, too. The very same SK Hynix 2× that produced the opening chart had returned about 798% in the six months before it — comfortably more than twice the stock’s own 307%.
Same structure, same decade, outcomes from seven times the index down to below it. So the product is not the variable. Something inside it produced both results — and it takes two minutes to see, because once you have it, every number above explains itself.
Why the same machine does both
The promise is three times the move of the index for a single day. Not three times your year.
Here is why one day does not add up to one year.
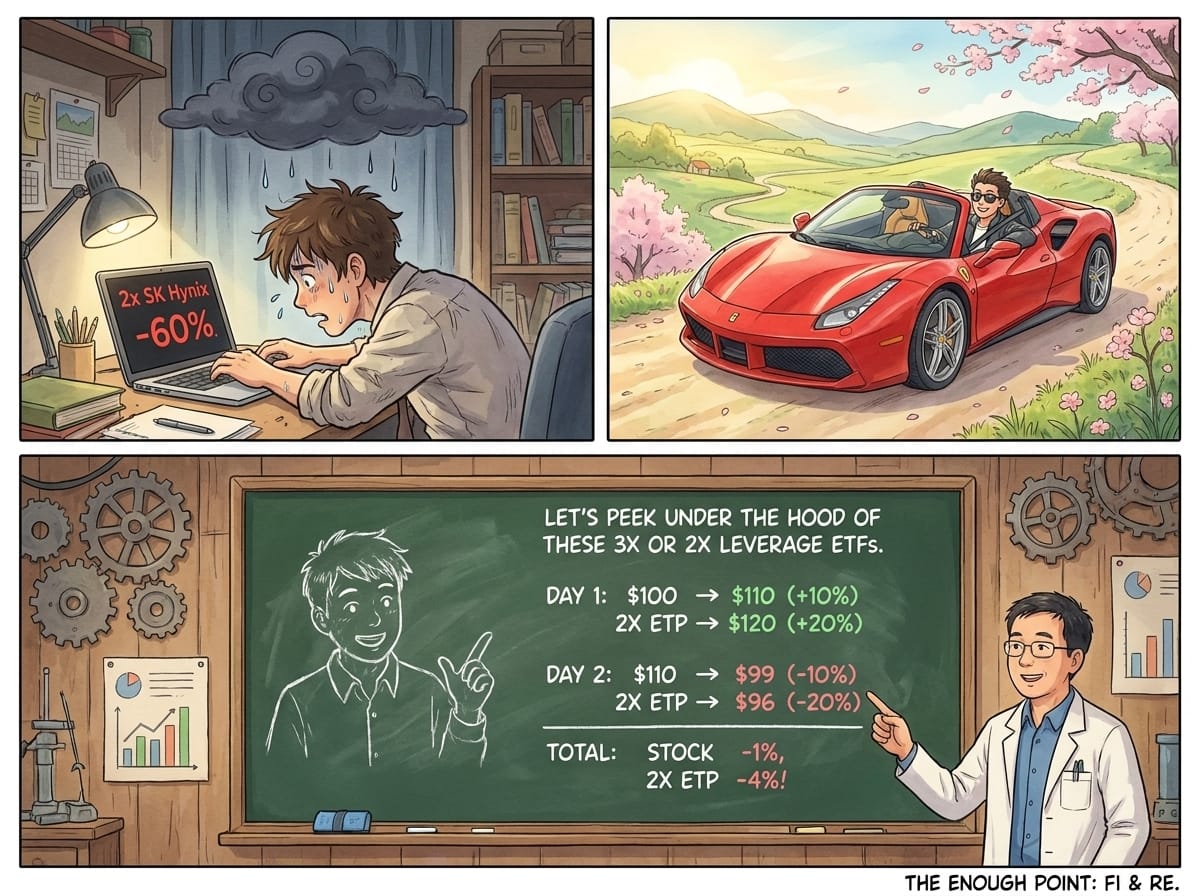
You put in $100. To give you 3× exposure, the fund holds $300 of the market.
Day one, the market rises 10%. That $300 becomes $330, so you have gained $30. Your money is now $130 — and to keep you at 3×, the fund must hold $390. It buys another $60 of the market. After it has gone up.
Day two, the market falls 10%. But now the fall applies to $390, not $330. You lose $39. You are left with $91.
Meanwhile the index went up 10% and down 10%, which leaves it at 99 — down 1%.
Three times a 1% loss should be 3%. You lost 9%. No fee was charged and nobody made a mistake. The fund simply had to buy more at the top of day one to keep its promise, and that larger position met the fall on day two.
That is the machine. Every day the market rises, it buys more. Every day the market falls, it sells. It is required to, because the promise is defined against whatever the fund is worth today.
That is the arithmetic. Here is what it did to a real market over three months.
The index fell 3%. The 3× fund fell 50%.
1 May to 31 July 2026, Korea. The 3× fund against the index it tracks, both on the same scale.
Three times a 3% fall is a 9% fall. Holders of the 3× fund lost 50% — roughly sixteen times the index’s loss, not three. The multiple on the label describes a single day; over three months it described nothing that happened.
It also topped out on 1 June, seventeen days before the index peaked on 18 June: over that stretch the index rose a further 1.2% while the fund lost 13.8%, falling while the market it tracks was still setting highs.
Which explains both halves of the chart earlier. In a market that climbs steadily, buying more after every up day is exactly the right move, and the machine hands you more than three times the index — that is the semiconductor and Nasdaq decade. In a market that lurches up and down without going anywhere, the same machine buys high and sells low, over and over, by design. That is small caps, and that is Korea.
One point in the machine’s favour, since it is owed. On the way down it works in reverse: as the fund shrinks it sells, so it carries less exposure into each subsequent fall. Three times Korea’s 28% drop would have been 84%, and the fund lost 76%. The daily reset is not simply a penalty — it is a volatility cost, not a direction cost. What it punishes is chop.
Where the line falls, on your own numbers
Now that the machine is on the table, you can find its break-even yourself.
It opens on the sector case above — SOXL’s published 1.32% fee, a 4.55% borrowing rate for mid-2026, and 30% volatility, which is mid-range for a single sector and well below a single stock. The 10% index return is a deliberately ordinary year, not a bad one. Change anything you disagree with.
Volatility is how much the index swings from day to day, annualised. A broad developed market sits near 15%. A single country or sector runs 25–40%. A single stock can be far higher. The borrowing rate is a short-term benchmark plus the bank’s spread — around 4.5% in mid-2026 — and a fund that gives you 3× is financing two of those three units.
—
What the index must return for the leveraged fund to merely match it
—
What this is. A model of one thing: the cost of resetting exposure every day in a market that moves. It answers what this structure does to a path with these characteristics, not what any particular fund will return.
What it leaves out. Gap risk, borrowing costs that change, tracking error and tax. Real markets are also not as well behaved as the model assumes — in practice the drag tends to be worse than this, not better.
It opens on an ordinary year — a 10% index return with 30% volatility — and the 3× fund loses 9% in a rising market. That is the case people do not price in.
But set the index return to 36.6%, which is what semiconductors actually delivered over the decade, and the same tool turns strongly positive. That is not a contradiction; it is the entire argument in one field. The drag never goes away. It simply stops mattering when a market runs hard enough for long enough — and nothing tells you in advance which kind of market you have walked into.
Singapore has its own version, and it goes to seven times
None of this is a distant American problem. The Singapore Exchange has listed Daily Leverage Certificates since 2017, at 2, 3, 5 and 7 times, long or short — on Apple, Nvidia and Tesla, on Tencent and Alibaba, and on DBS, OCBC, UOB, Singtel and Singapore Airlines. They reset daily, exactly as above, and SGX says so plainly in its own materials.
What stands between an ordinary investor and 7× leverage on a single bank stock is one form. A broker must run a Customer Account Review first, which you pass with a relevant qualification, three years of relevant work, six such trades in three years — or a free online quiz. And on 15 May 2026 the Monetary Authority concluded a consultation that would remove the mandatory financial-advice requirement for complex products altogether. Fewer gates, not more, which is precisely the setting Korea listed its two funds into.
What to take from this
The product is not the problem. On a market that trends, a daily-reset fund does what it advertises and can beat even the multiple people expect of it. On one that churns, the identical machine grinds you down while you are right about the direction — and you do not get to know which you are in until afterwards.
The published return is not the return you got. Every fund here that made a fortune also required its holders to sit through 80% and 90% falls without selling. Those who collected were not smarter than those who did not. They had the stomach, or the inattention, to stay put — a far rarer qualification than having the right view.
None of it is hidden. The Hong Kong issuer prints “up to 40% a year” in costs. The American one prints that its fund “should not be expected to provide three times the return… for periods greater than a day”. It is simply never on the poster.
So what matters before you buy one is not a view on the market. It is two numbers, written down before you press the button.
The price at which you will sell — decided while you are calm, knowing a 2× fund reaches it twice as fast, and a 3× fund three times as fast, as the stock you are actually thinking about.
The amount you could watch halve, twice, without changing your mind. That is your position size, and for most people it is far smaller than the sum they were about to put in.
If you cannot write both down, you have your answer. And if you can, keep them somewhere you will find them on the bad day — because on the evidence above, the bad day is not a tail risk in these products. It is a feature of holding them.
Sources, and where our numbers are soft
Sources
All standardised returns are each issuer’s own published figures, NAV basis, as of 30 June 2026: ProShares for TQQQ and UPRO, Direxion for SOXL, TNA and KORU, Invesco for QQQ, iShares for SOXX, IWM and EWY, and State Street for SPY. Those published figures are average annual returns, not cumulative ones, for every period of a year or longer — the issuers say so in their own fact sheets (“returns for performance under one year are cumulative, not annualized”). The outcome multiples are ours, computed by compounding those annual averages over ten years; the underlying figures sit in the table so the arithmetic can be checked. We compare each leveraged fund against the ordinary fund tracking the same market rather than against the index itself, because an index cannot be bought — which also makes the comparison slightly more conservative than using the index would. SOXL and SOXX track the same benchmark, the NYSE Semiconductor Index, which makes that the cleanest pair in the set. Fund objective and warning language: the Direxion and iShares Korea product pages. Price paths and drawdowns, including the 90% fall and the count of falls beyond half, computed by us from split-adjusted public closing prices, July 2010 to July 2026.
Hong Kong products, holdings, year-to-date returns, cost disclosures and the “not intended for holding longer than one day” wording: CSOP Asset Management’s own product pages and key facts statements for the SK Hynix 2× (7709.HK), Samsung Electronics 2× (7747.HK) and Nvidia 2× (7788.HK), with returns as at 30 June 2026 and assets as at 31 July 2026. The report that the SK Hynix product peaked above US$20 billion before falling 70–80% is from secondary press rather than an issuer or exchange statement — we have flagged it as such rather than dropping it, because the direction is corroborated by the fund’s own published performance.
The Nvidia chart is built from daily closing prices for NVDA and 7788.HK, 31 December 2025 to 30 June 2026, rebased by us so both begin at zero. These are traded prices, not net asset values, and the distinction is not cosmetic: CSOP’s published year-to-date figure for the fund is −0.49% on a NAV basis, while its traded price ended the same period 5.06% down. We show the traded price because that is what an investor buys and sells at, and we print both rather than choose the flattering one. Note also that the fund is listed in Hong Kong and the stock trades in New York, so the Hong Kong session closes before the American one opens — the fund’s move on any given day reflects the stock’s move the day before. We checked this rather than assumed it: fund returns correlate 0.77 with the previous day’s Nvidia return and only 0.17 with the same day’s.
Korean single-stock leveraged funds — listing date, products and issuers: Samsung Asset Management’s own KODEX product pages and KED Global. Asset growth and the retail share: Korean financial press including Financial Today and Seoul Economic Daily. The underlying stocks’ drawdown: market data via Yahoo Finance. Regulatory response and deposit change: Korea JoongAng Daily.
Singapore products, leverage factors, and the daily-reset and air-bag wording: SGX’s Daily Leverage Certificates page and the issuer’s handbook. Customer Account Review criteria: MoneySense, the MAS-run consumer portal. Consultation outcome: MAS media release, 15 May 2026. All checked 2 August 2026; the calculator’s derivation is documented in its source code.
Where our numbers are soft
The drawdown study is evidence, not a law. It covers sixteen years and a handful of funds, and those sixteen years contained one of the strongest bull runs in market history — which is precisely why the winning cases look as good as they do. Read it as a description of what this era did, not a forecast of the next.
The S$10,000 chart crosses a currency line. SK Hynix trades in won in Seoul; the 2× fund on it trades in Hong Kong dollars. We have rebased both to Singapore dollars so the two paths are comparable, which means a slice of the gap between them is exchange-rate movement rather than leverage. It is a small slice over five weeks — the leverage does nearly all of the work — but a Singapore buyer of the Hong Kong product genuinely carries that currency layer, and the chart is honest to include it rather than assume it away.
The Korean episode is reported from Korean issuer notices, Korean financial press and market data. The asset and retail-share figures circulate in several outlets with small variations, so treat “roughly US$3 billion to roughly US$9 billion” and “roughly 92% retail” as well-supported approximations rather than audited numbers. The underlying stocks’ fall of more than 20% from their late-June highs is the most solidly sourced fact of the set.
Our figures also come from a small number of funds over particular windows, which is a fair thing to be suspicious of. The underlying relationship is neither ours nor new: Avellaneda and Zhang derived it formally and tested it across 56 leveraged funds, and independent work has checked it against more than a century of data across eight equity markets. More recent research argues the picture is subtler still — that outcomes turn on whether a market trends or mean-reverts, not on volatility alone, which is consistent with the two-sided result above.
A note on what this is not. We are not telling you to buy or avoid anything, and we name these funds only because the arithmetic needs a real example — the mechanism belongs to every daily-reset product, whichever issuer runs it. We have no commercial relationship with any fund manager or exchange, carry no advertising, and earn nothing from any link on this page.
General information and education only. This is not financial advice and takes no account of your objectives, situation or needs. Leveraged products can lose value rapidly, including in markets that eventually move your way. Past returns describe the past. Check current fund documents before relying on anything here.