You have a balance of miles. The airline shows you the number and never shows you a price.
So here is the price, and the striking thing about it is the range. A KrisFlyer mile is worth roughly one cent if you spend it one way, and roughly five cents if you spend it another. On a balance of 100,000 miles, that is the difference between S$1,000 and S$5,000.
Nothing about the miles changes between those two numbers. No skill, no status, no secret. The entire gap is one decision — what you point them at — and this article is about making that decision on purpose.
The easy option pays about a cent
Start with the floor, because it is the option you get for doing nothing at all.
Since 1 July 2025, Singapore Airlines has converted miles at the same rate everywhere in its own world: 100 miles = S$1. That covers the KrisShop, Kris+ at partner shops and restaurants, Pelago experiences, and paying for part of an ordinary ticket with miles. One cent a mile, no seat to hunt for, no dates to work around. Before that the rate wandered between about 0.67 and 0.95 cents depending on which door you used.
The tempting conclusion is that a mile can therefore never be worth less than a cent. That is wrong, and the reason matters, because there is a difference between the rate you are given and the value you receive.
One cent is what the airline credits you. What you actually get depends on whether the thing you bought was fairly priced to begin with. The example worth remembering comes from The MileLion: a pair of Sony headphones at S$559 in the KrisShop and S$507.76 on Amazon. Pay the KrisShop price in miles and you have handed over 55,900 miles for S$507.76 of headphones — 0.91 cents a mile. The rate was honoured to the letter. The value simply was not there.
So the cent is a ceiling on the lazy option rather than a floor beneath you, and it varies by door:
- Kris+ comes closest to a real cent, because the shops and restaurants charge their ordinary prices.
- Paying part of a ticket in miles is close, but not clean — a ticket part-paid with miles earns you fewer miles back than the full cash fare would have, and that loss is a real cost.
- The KrisShop is where a cent becomes the most you could possibly get, and only on things the shop cannot mark up.
Which sets up the only question that matters for the rest of this piece: what has to be true for a mile to be worth several times that?
Why business class changes the answer
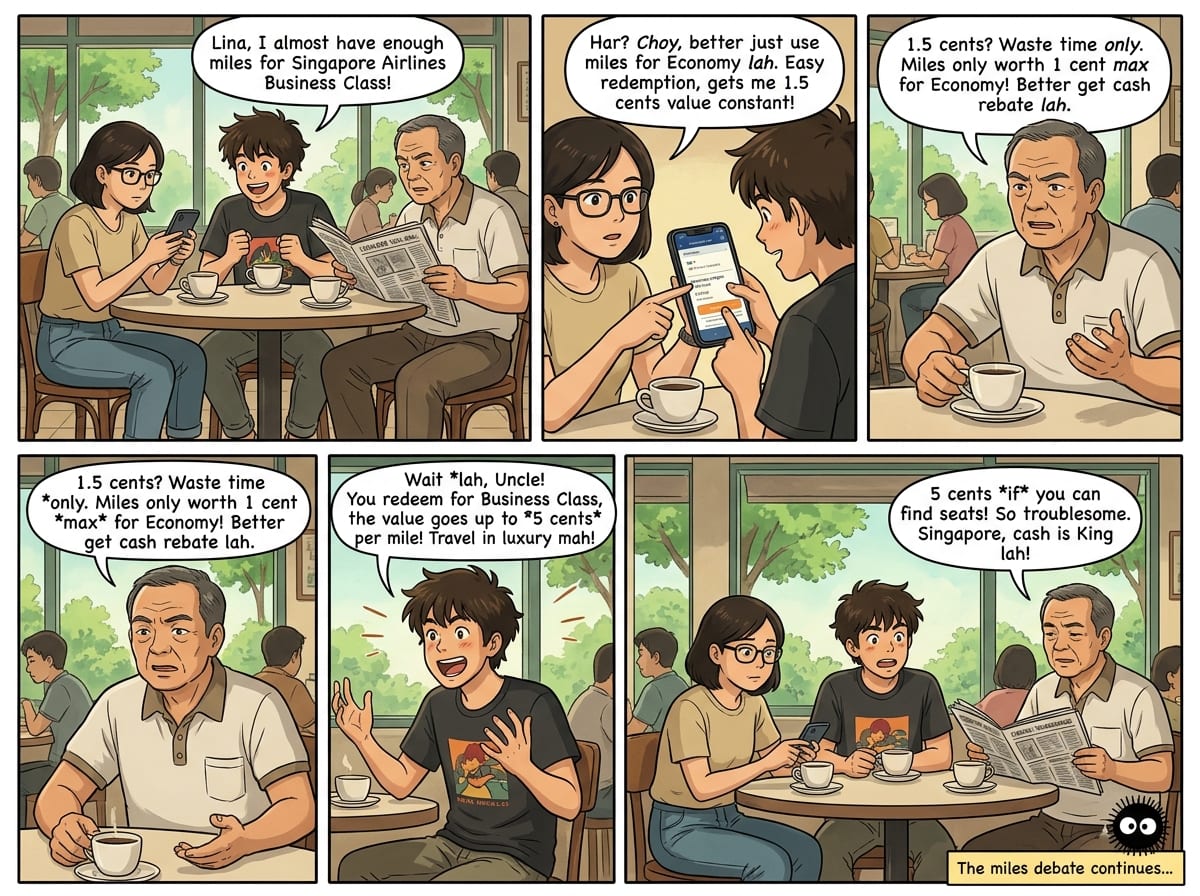
The answer is not about luxury. It is a quirk in how the airline prices two different things.
Singapore Airlines publishes a chart showing how many miles each seat costs. Here it is for the routes in this article.
One route, to make the point once. Singapore to Africa, one way, at the cheapest award tier. The bars show how many times the economy price each cabin costs — not the mileage, which is printed beside them.
The same pattern across five zones — it is a rule, not a quirk of one route
Business runs 2.07×–2.48× the economy price across the zones in this article, and First or Suites 2.95×–3.38×. The route above sits below the middle of that range, so it is not the flattering case.
| Zone | Economy | Business | First / Suites |
|---|---|---|---|
| 5Beijing, Shanghai | 20,5001.00× | 45,0002.20× | 61,5003.00× |
| 8Perth, Darwin | 20,5001.00× | 42,5002.07× | 60,5002.95× |
| 9Australia (others), NZ | 29,0001.00× | 72,0002.48× | 98,0003.38× |
| 10Africa, Middle East, Turkey | 32,0001.00× | 68,0002.13× | 95,0002.97× |
| 11Europe | 44,0001.00× | 108,5002.47× | 148,0003.36× |
What this is. Singapore Airlines’ own one-way Saver award pricing, at the cheapest tier. Premium economy is left out for legibility, not for judgement.
What it is not. A claim about availability. Saver seats are the cheapest rung and the scarcest — a published price you cannot book is worth nothing, and no chart shows how many seats sit behind each number.
a theenoughpoint.com toolLook at what that chart charges. A business seat costs about two to two and a half times the miles of an economy seat. A Suite, about three times. Those are not estimates — that is division applied to a published document.
Now think about the cash prices for those same two seats. On a long-haul route, a business ticket does not cost two and a half times the economy fare. It costs a great deal more than that. We are deliberately not printing a number, because the honest one is whatever you saw on the day you looked.
And there is the whole thing. The airline charges a big premium in dollars for the front of the aircraft, and only a small premium in miles. Your miles do not know which seat they are buying. Point them where those two gaps are widest and each mile does several times the work.
It also explains why the thrifty-feeling move is usually the worst one. Spending miles on a cheap economy ticket means handing over a currency worth a cent to buy the one seat the airline is already discounting for cash.
Our own 2013 spreadsheet showed this before we understood it. Singapore to London, the same route on the same day: against the flexible economy fare a mile came out at 3.24 cents, against the deepest economy sale fare 0.91 cents, and in business 4.67 cents. One mile, five times the difference, decided purely by what it was aimed at.
One caution before you get excited. The chart is flat, but the availability is not. The cheap business seats are released in far smaller numbers than the cheap economy ones, so the best rung on the ladder is the hardest one to actually stand on. Our own Cape Town booking further down is what that looks like when it goes against you.
The question that keeps you honest
Now the mistake, which was ours before it was anyone else’s.
That 2013 spreadsheet valued the London business seat at its published fare of S$7,366, and reported a handsome answer. The figure was fictional, in a way that matters: we were never going to spend S$7,366 on that ticket. Nobody in the family was. Without the miles, we would have flown economy or stayed home.
The MileLion puts the correction more bluntly than we would dare: you cannot claim your miles are worth a high figure unless you would genuinely have paid cash for that ticket.
So the honest question is not “what was that seat worth?” but “what would I actually have spent if the miles had not existed?” For most people the true answer for a premium seat sits somewhere between “the economy fare I would really have booked” and “the business fare I enjoyed” — and exactly where is a personal judgement nobody can look up for you.
That is what the slider below is for. Put in your own numbers.
The miles and taxes in each preset are our own bookings, transcribed from the airline’s confirmation emails — those figures are exact. Every fare is an illustrative placeholder: airfares are reset daily, we cannot verify what a seat cost on a date that has passed, and we will not publish numbers we cannot check. Put in the fares you actually saw, and the answer becomes yours rather than ours.
| What the card earns | Return | Beats cashback? |
|---|
What this is. One redemption, priced. The seat is valued at what you would genuinely have spent without the miles, the cash you still paid is deducted, and the result is divided by the miles it cost. Multiplying that by a card's earn rate turns it into the only figure that compares like for like against a cashback card: cents returned per dollar spent.
What it leaves out. Card annual fees and the roughly S$27 many banks charge to move points across — both reduce the rebate, and neither is knowable from here. The KrisFlyer miles you would have earned had you bought the ticket with cash, which an award ticket does not pay. Change and cancellation fees. The time spent, which is not nothing. And the value of the flexibility you gave up or gained, which no honest model prices.
What this is not. A recommendation of any card, cabin or programme, or a forecast of what a mile will be worth later. Award charts are revised at the airline's discretion — the November 2025 devaluation is the standing proof — and a value per mile computed today says nothing about the chart you will face when you come to book.
a theenoughpoint.com toolDrag that slider to zero on any preset and watch the answer fall apart. That collapse is the honest argument against miles for a household that would never buy a premium seat with cash, and it deserves saying as plainly as the argument for. If you would fly economy regardless, a business redemption is a real pleasure and a poor financial case, and a simple cashback card was probably the better tool all along.
The case for miles survives that test for two kinds of people: those who would genuinely have bought the front cabin, and those for whom the upgrade is worth a large slice of its price even though they would not have paid all of it. Both are honest positions. Neither is everybody.
Is it beating a plain cashback card?
Once you know what your miles are worth, the card question is simple arithmetic.
Miles beat cashback when what a mile is worth, times how many miles you earn per dollar, is more than the cashback rate. Rearranged, that gives the one number to carry around:
cashback rate ÷ miles per dollar = the value per mile you need
At the 1.7% paid by the best flat cashback card in Singapore:
| If your card earns | Your miles must be worth at least |
|---|---|
| 1.2 miles per dollar | 1.42 cents |
| 1.4 miles per dollar | 1.21 cents |
| 2.4 miles per dollar | 0.71 cents |
| 4 miles per dollar | 0.43 cents |
Read that against the cent you get for cashing out and something uncomfortable falls out. An ordinary card earning 1.2 to 1.4 miles per dollar does not beat cashback if you cash the miles out. It needs 1.21 to 1.42 cents a mile just to draw level — so miles spent in the KrisShop would have been better off as cashback, with no annual fee and no three-year expiry clock.
One caveat on the bottom row, since it is the one people misread: 4 miles per dollar applies to a slice of your spending, not all of it. Those cards stop paying the bonus rate after about S$1,000 a month. We have written separately about what that does to your real average, and the short version is that it lands most households far closer to the 1.2 and 1.4 rows.
Which produces the sentence this section exists for. The miles game is not free money. It is paid work. The wages are the gap between what you earn and the cashback you turned down. Decide whether you want the job before optimising how you do it.
The catch: the cheap seats barely exist
One more thing stands between a published price and an actual seat, and it is what turns a tidy calculation into a hobby.
The airline sells the same seat at up to four different prices. Cheapest is Saver, and nearly all the value in this article lives there. Advantage costs about 80% more and is far easier to get. Access is dearer still and always available. Promo is cheapest of all and almost never there.
| Award | What it costs | When you can get it | Stopovers | Changes & refunds | Waitlist |
|---|---|---|---|---|---|
| PromoThe cheapest miles in the programme, sold on the airline’s terms rather than yours. | About 30% below Saver | Only in the monthly Spontaneous Escapes window, on selected routes, for travel the following month | None | No changes, no refunds | No |
| SaverWhere nearly all the value in this piece comes from, and the reason plans start eleven months out. | The chart price — the baseline | Every route, all year, in genuinely limited numbers | One on a return | S$25 to change a date; S$75 to refund | Yes — clears close to departure if at all |
| AdvantageThe seat that is actually there when you look. You are paying miles for certainty. | Roughly 80% above Saver on average | Every route, all year, in far greater supply | Two on a return | Free date changes; S$25 other changes; S$50 to refund | Yes |
| AccessIntroduced 1 November 2025 and already repriced upward once. The emergency door, priced like one. | Dynamic — marked up over Advantage, up to about double it in business | Last seat, any date, including peak periods | Two on a return | Free date changes; S$25 other changes; S$50 to refund | No |
Source. Award-type rules and fees as documented by The MileLion, November 2025. Fees are per passenger, payable in cash, and revisable by the airline — confirm against Singapore Airlines’ own terms before you book.
a theenoughpoint.com toolSaver seats on a popular route in a school holiday are gone the moment booking opens, eleven and a half months ahead. A six-seat family redemption is not a booking; it is a diary entry made a year in advance.
We can price what that scarcity costs, because we paid it. Four of us flew to Cape Town on SQ 478 on Thursday 4 June this year — one aeroplane, one date, four seats in the same cabin. Two were booked at Saver, 56,500 miles each. The other two, booked a week later once it was clear no more cheap seats would appear, cost 103,500 miles each.
Identical seats on an identical flight, 83% apart. Not a better cabin, not a better date, not more flexibility in any way we noticed. The only difference was that two cheap seats existed and two did not. Those two extra bookings cost 94,000 miles more, which is most of another long-haul business ticket, spent on nothing.
One boundary on all of this: this is a Singapore Airlines article. KrisFlyer also books Star Alliance partners on a separate chart, and several of those airlines add fuel surcharges that KrisFlyer passes straight to you, which can eat a redemption before you have flown a metre. That deserves its own piece.
The price can change while you are saving
And now the risk no amount of cleverness removes.
Not one of these seats got better. The same flight, the same cabin, the same airline — repriced overnight by the party that issues the currency. Note where the increases land: the Advantage awards you actually get to book, and Zone 10, which had been the best value on the chart.
What this shows. Ten award prices that exist on both the chart in force to 31 October 2025 and the chart effective 1 November 2025, in the three zones this piece uses. It is a sample of the revision, not the whole of it.
The other direction, in fairness. Economy Saver awards in zones 1–9 came down by about 5% in the same revision — the first row here is one of them. The pattern is consistent rather than random: the cheap cabin got cheaper and the front of the aircraft got dearer.
And since. Access awards, introduced at that same revision, were themselves repriced upward on 28 March 2026, by up to about 11% in economy and premium economy — four months after launch, against no published chart.
a theenoughpoint.com toolNine months ago these seats were repriced, and every mile already earned was worth less the next morning. Notice where the increases landed: on the awards that are actually available, and on the zone that had been the best value on the chart. In fairness, economy fares in the nearer zones got cheaper — the revision had a direction, and it was to charge more for the front of the aircraft, which is exactly where this article says the value is.
The longer view comes from our own file. That 2013 workbook priced a Singapore–London business return at 136,000 miles, including a 15% discount then given for booking online. The same return today costs 217,000 miles.
There are two honest ways to read that. What a customer actually pays rose 136,000 → 217,000, up 59.6%, or 3.8% a year, because the online discount was itself withdrawn along the way. What the chart charges rose 160,000 → 217,000, up 35.6%, or 2.4% a year. The first is what your balance experiences; the second is the cleaner like-for-like. Neither is small.
Call it what it is: an inflation rate on a currency you cannot hedge, set by the people who issue it, announced after the fact. It is not a reason to avoid miles. It is a decisive reason to treat a balance as perishable rather than saved — and it sits on top of the programme’s own three-year expiry.
Which gives the most valuable habit in the whole hobby, and it is not clever: earn towards a trip you can already name, and book it. Miles held are exposed to a chart that will be revised. Miles booked are a seat.
What we actually redeemed
Here is our ledger, taken from the confirmation emails rather than from memory.
Miles and taxes exactly as billed by the airline, not reconstructed from a chart. The tier column is established by matching those billed miles to the published award chart for the date of booking, and is left blank where we could not verify the relevant chart cell. Booking references, names and membership numbers are deliberately absent.
| Sector | Cabin | Tier | Pax | Miles | Tax |
|---|---|---|---|---|---|
| Singapore → ShanghaiSat 7 Dec 2024 | Business | Saver | 6 | 258,00043,000 each way | S$391.20 |
| Hong Kong → SingaporeSun 22 Dec 2024 | First | — | 2 | 146,00073,000 each way | S$670.00 |
| Hong Kong → SingaporeSun 22 Dec 2024 | Business | Saver | 4 | 136,00034,000 each way | S$1,100.00 |
| Sector | Cabin | Tier | Pax | Miles | Tax |
|---|---|---|---|---|---|
| Singapore → Denpasar and backFri 5 Sep 2025 | Business | Saver | 4 | 168,00021,000 each way | S$341.20 |
| Sector | Cabin | Tier | Pax | Miles | Tax |
|---|---|---|---|---|---|
| Singapore → Cape TownThu 4 Jun 2026 | Business | Saver | 2 | 113,00056,500 each way | S$130.40 |
| Singapore → Cape TownThu 4 Jun 2026 | Business | Advantage | 2 | 207,000103,500 each way | S$130.40 |
| Johannesburg → SingaporeFri 12 Jun 2026 | Business | Saver | 4 | 226,00056,500 each way | S$2,236.68 |
| Sector | Cabin | Tier | Pax | Miles | Tax |
|---|---|---|---|---|---|
| Singapore → SydneyMon 19 Oct 2026 | Suites | Advantage | 1 | 178,500178,500 each way | S$104.70 |
| Brisbane → SingaporeSat 24 Oct 2026 | Business | Saver | 1 | 72,00072,000 each way | S$110.77 |
How the years were established. Singapore Airlines prints the day and month on a confirmation but not the year — “04 Jun (Thu)”. Each date here was resolved by matching the printed weekday against the calendar, and every one resolved to exactly one year in the plausible range. None is a guess.
The blank tier. The December 2024 First award is shown without one. Its 73,000 miles a head does not match any chart cell we were able to verify for Hong Kong on the chart then in force, so we do not label it Saver or Advantage. It is the one row here we would want an award-chart specialist to check.
What is missing. These are the nine confirmations we hold, not necessarily every flight of every trip — positioning sectors bought with cash or flown on other airlines do not appear, and neither does anything redeemed before 2024.
a theenoughpoint.com toolOne and a half million miles, and S$5,215 of tax, for thirty one-way journeys in the front of the aircraft. Three things in it are worth pulling out.
The taxes are not a rounding error. They came to S$5,215.35 in cash and they are wildly uneven: the Johannesburg–Singapore leg alone was S$2,236.68 — 43% of all the tax across nine bookings — for a single flight. The same trip outbound cost S$65.20 a head; coming home cost S$559.17 a head, eight and a half times as much, same four people, same cabin. Award tickets are not free tickets.
You can watch the chart move. The Shanghai seats were booked in January 2024 at 43,000 miles each, the going rate then. The Sydney Suite was booked on 6 November 2025 at 178,500 — the price on a chart that had taken effect five days earlier. Both were correct on the day. Neither is correct now.
And you get the seat that exists, which is the Cape Town pair above.
Two honest notes. First, we have deliberately not published a cents-per-mile figure for any of these, and will not. Doing so would mean telling you what we would have paid in cash for seats we did not buy, which is a judgement about our household rather than a fact — exactly the move this article warns against. The miles and taxes are exact, they are loaded into the tool as presets, and the honest part is yours to supply.
Second, the thing that generalises is not financial. Those family redemptions happened because somebody sat down eleven months ahead and held the dates. That is a planning habit, not a money technique, and it is what separates people who fly on miles from people who accumulate them.
What to do with the miles you have
Five steps, and the first two settle it for most people.
-
Answer the honest question first. Would you, with your own money, buy a long-haul premium ticket? If the answer is a settled no, the case for miles over cashback is weak, and this is a hobby you may still enjoy — just not one filed under money management.
-
Work out the number your card has to beat. Cashback rate divided by miles per dollar. On an ordinary 1.2 to 1.4 card you need a redemption above roughly 1.2 to 1.4 cents a mile to have been right, and cashing out will not get you there.
-
Point them at the front of the aircraft, where the miles price and the cash price are furthest apart — which is also, unhelpfully, where the cheap seats are scarcest.
-
Book, do not accumulate. Name the trip, then earn towards it. A balance faces a chart revision and a three-year clock. A confirmed seat faces neither.
-
Then price what you actually did, honestly, with the tool above. If the answer comes out under a cent, the programme is telling you something useful, and it is not a criticism of the trip.
No commercial relationship
We hold no affiliate, referral or advertising relationship with any bank, card issuer or airline named here, and nothing in this piece is a paid placement. Cards and programmes are named so that you can check our arithmetic against their published terms, not as recommendations. This is general information about how a loyalty programme prices things — not financial advice, and not a view on what any individual should hold, spend or redeem.
Sources and verification — primary where it exists, verified 12 August 2026. Every load-bearing figure below, one line each.
- The one-cent conversion (100 KrisFlyer miles = S$1 across part-paid SIA and Scoot tickets, Kris+, KrisShop and Pelago, harmonised from 1 July 2025, replacing rates that had ranged roughly 0.67–0.95 cents): The MileLion’s report of the change.
- Why that rate is a ceiling rather than a floor (KrisShop prices may sit above market, so the official rate overstates value received; the worked example of Sony headphones at S$559 on KrisShop against S$507.76 on Amazon, giving 0.91 cents a mile): The MileLion, What to do with expiring KrisFlyer miles. This corrects an earlier version of this article, which described the one-cent rate as a floor beneath which a mile could not fall. That was wrong, and the correction is his.
- The valuation method — value per mile as (the cash fare you would genuinely have paid − the taxes still payable) ÷ miles used, and the discipline of only counting fares you would truly have bought, together with the 1.5-cent acquisition / 1.7-cent redemption guidance: The MileLion, What is the value of a mile?. The framework is his; the arithmetic laid over it is ours.
- Award chart figures — one-way Saver and Advantage awards from Singapore, chart effective 1 November 2025, for Zone 5 (Beijing, Shanghai), Zone 8 (Perth, Darwin), Zone 9 (Australia others, New Zealand), Zone 10 (Africa, Middle East, Turkey) and Zone 11 (Europe). Singapore Airlines publishes this chart as a PDF; we could not retrieve that file directly, so the figures here come from two independent transcriptions of it, cross-checked against each other, with the resulting pre- to post-revision percentage moves reconciled against The MileLion’s separately reported changes. No figure appearing in only one source has been printed. Confirm against Singapore Airlines’ own chart before booking.
- The November 2025 devaluation (effective 1 November 2025; economy Saver down about 5% in zones 1–9, business and First Saver up about 5%, zone 10 up 10–20%, Advantage awards up 15–18%; Europe business Saver 103,500 → 108,500 and Europe business Advantage 123,000 → 141,500 as the worked examples): The MileLion’s pre-devaluation briefing, reconciled against the two chart transcriptions above.
- Award types, fees and rules (Promo about 30% below Saver with no changes or refunds; Saver S$25 to change and S$75 to refund; Advantage about 80% above Saver on average, free date changes, S$50 refund; Access dynamically priced above Advantage, no waitlist): The MileLion, Promo, Saver, Advantage and Access — what’s the difference?.
- Access award pricing and its March 2026 revision (business tiers from about Advantage +29% to +106%; typical realised value around 2–3 cents a mile against 3–5 for Saver and Advantage; repriced upward by up to about 11% in economy and premium economy on 28 March 2026, four months after launch): The MileLion, Complete guide: KrisFlyer Access awards. The “one cent, or five” in this article’s title is the span between cashing out and a well-used Saver or Advantage redemption, and rests on that reporting.
- Miles expiry (KrisFlyer miles expire three years after they are earned, at the end of the corresponding month; extension costs 1,200 miles or US$12 per 10,000 miles for six months): Singapore Airlines KrisFlyer terms and conditions.
- Award tickets earn nothing — no KrisFlyer miles, Elite miles or PPS value accrue on a redeemed ticket, a real second-order cost this article’s tool leaves out of the arithmetic and names in its notes: Singapore Airlines’ published redemption FAQs.
- Points-currency mechanics (conversion fees to KrisFlyer of about S$25–S$30 at most banks, with Amex and HSBC free; 10,000-mile minimum transfer blocks at several; transfer times from instant to 72 hours): The MileLion, Which bank offers the best points currency?.
- The cashback hurdle (1.7% as the highest uncapped flat-rate cashback available in Singapore as at mid-2026, with 1.5–1.6% alternatives, and exclusions that apply to all of them): compiled from published card terms and market comparisons as at August 2026. Rates change; check the issuer’s own page before treating the hurdle as settled.
- Card earn rates used illustratively in the breakeven table (1.2 and 1.4 miles per dollar on general local spend, about 2.4 on overseas spend, 4 on capped bonus categories): representative of the Singapore market as at August 2026 per issuer terms and The MileLion’s 2026 strategy. No card is recommended and no specific card’s rate is asserted here as current — verify with the issuer.
- The 2013 comparison (Singapore–London business return at 136,000 miles including the then-available 15% online redemption discount, against S$7,366 all-in and S$1,016 of taxes, giving 4.67 cents a mile; economy on the same route at 3.24 cents on the flexible fare and 0.91 cents on the deepest sale fare): computed by us from our own workbook, Credit Card Miles Table, data as at 22 December 2013. Today’s comparison figure of 217,000 is two one-way Zone 11 business Saver awards; 136,000 → 217,000 is +59.6% over 12.64 years, or 3.77% a year, and the undiscounted 160,000 → 217,000 is +35.6%, or 2.44% a year.
- Our own redemptions — nine Singapore Airlines booking confirmations covering four trips between December 2024 and October 2026. Miles and taxes are transcribed exactly as billed. Award tier is established by matching those billed miles to the published chart. Travel years are not printed on these confirmations (they show “04 Jun (Thu)” and no more), so each date was resolved by matching the printed weekday against the calendar with a date library; every one resolved to exactly one year in the plausible range, so no date here is a guess. Booking references, passenger names, membership numbers and card digits appear in the source documents and appear nowhere in this article. No cents-per-mile figure is published for any of these bookings, because the numerator would be a statement about what we would have paid in cash for tickets we did not buy.
- A useful corroboration. Four of those bookings independently confirm award-chart figures this article took from secondary transcriptions. Shanghai in December 2024 was billed at 43,000 miles a head, the pre-revision Zone 5 business Saver price; Cape Town at 56,500 and 103,500, the pre-revision Zone 10 business Saver and Advantage prices; Sydney at 178,500, the Zone 9 First Advantage price on the chart that took effect five days before it was booked; and Brisbane at 72,000, the post-revision Zone 9 business Saver price. Each matches to the mile.
- Rewritten 13 August 2026 for clarity, on the reader’s objection that the piece was hard to follow. The argument and every figure are unchanged; the vocabulary is not. It now opens on the reader’s own balance rather than on our spreadsheet, states the range in dollars before introducing cents per mile, and drops the terms that assumed prior knowledge.
A standing credit. A great deal of what Singapore knows about this subject was worked out in public, over more than a decade, by Aaron Wong at The MileLion. Where this article states a programme rule, a fee or a devaluation detail, his reporting is usually the reason we know it. The valuation framework is his; the mistakes are ours. If this piece is useful to you, his site is the place to go next.