A new ETF may buy you more of what you already own. Four of these funds hold the same five American companies.
The published fund fee is only one part of the decision. Local trading hours, SRS access, the actual buying and selling prices, and the fund structure matter too.
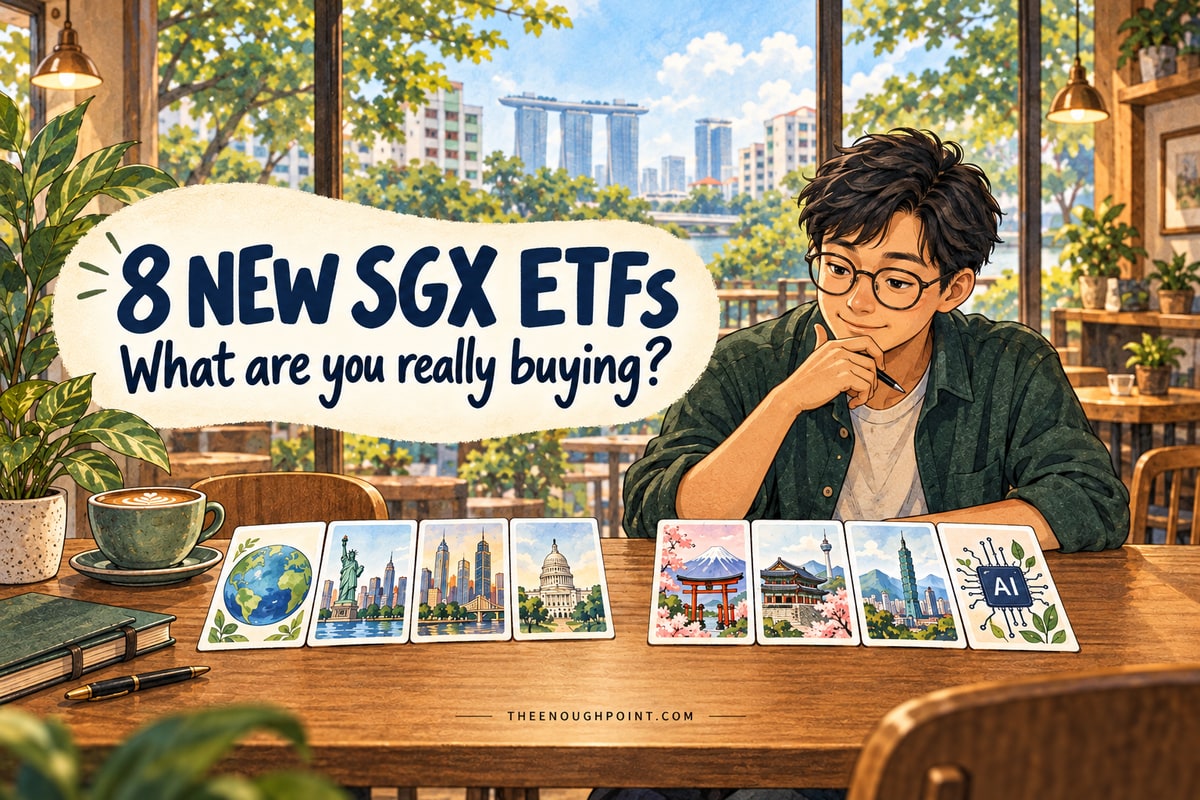
The timetable. Four Xtrackers funds began trading on Tuesday 13 October 2026: S&P 500, Nasdaq-100, MSCI World and S&P 500 Equal Weight. Four iFAST funds follow on Thursday 22 October: Nikkei 225, MSCI Korea, MSCI Taiwan, and AI & Big Data. Each iFAST fund holds one Xtrackers fund.
The earlier piece covers the US estate-tax mechanics. SRS means the Supplementary Retirement Scheme, whose savings can buy these SGX-listed ETFs.
Disclosure
This article is not sponsored and carries no affiliate or partner links. The partner-link note in the sidebar is a site-wide statement and applies to no link on this page. iFAST’s own material is used for its published fee estimates, with its commercial interest identified. Every fund, broker and platform named is a checkable example, not a recommendation.
What can you buy that was missing?
The additions fill gaps in the choice of markets. SGX gains a fund tracking shares across developed countries, plus separate Japan, Korea and Taiwan index funds. The new US funds trade in Singapore dollars. The China, regional and Singapore ranges do not grow this round.
The June 2026 SGX report counted 53 ETFs and leveraged products, including 15 focused on China and 14 on Singapore. Adding these eight gives 61 before any other listings or removals since June. This is an illustration, not a verified October total.
The menu before and after: the full category comparison.
SGX counted 53 ETFs and leveraged products at the end of June 2026, holding S$20.5 billion, of which retail investors held 42%. Adding this month’s eight gives 61 before any other listings or removals. Fifteen of the 53 are China-focused and 14 are Singapore-focused. By building block:
| What you want to own | On SGX at June 2026 | Added in October 2026 |
|---|---|---|
| The developed world in one fund | None; the global funds were US-only | MSCI World (XWR) |
| The United States | SPDR S&P 500 (S27, US-registered, in US$) and a Dow Jones fund | S&P 500 (XUS), S&P 500 Equal Weight (EUS), Nasdaq-100 (XND), in S$ |
| Japan, Korea or Taiwan on its own | One actively managed Japan fund | Nikkei 225 (JPY), MSCI Korea (KOR), MSCI Taiwan (TWD) |
| China | 13 share funds and 2 bond funds | None |
| Asia and emerging markets | 5 regional funds; India, Indonesia and Vietnam on their own | None |
| Singapore shares, bonds, REITs and gold | 14 lines | None |
| A theme | A China electric-vehicle fund, a South-east Asia technology fund | AI & Big Data (XBG) |
Counts from SGX’s half-year report (June 2026) and the two issuers’ prospectuses. The categories are SGX’s. Order is by building block, not a ranking.
The additions expand developed-market and individual-country access; they add nothing to the China or Singapore ranges.
Different funds can own the same shares
Different fund names can lead back to the same companies. Nvidia, Apple, Microsoft, Amazon and Alphabet are the S&P 500 fund’s five largest holdings. They also make up a large part of the Nasdaq-100, AI and developed-world funds.
Nvidia, Apple, Microsoft, Amazon and Alphabet, as a percentage of each fund.
- Nasdaq-100 (XND)31.7%
- S&P 500 (XUS)30.6%
- AI & Big Data (XBG)23.9%
- MSCI World (XWR)21.7%
- S&P 500 Equal Weight (EUS)about 1%
- Nikkei 225 (JPY)0%
- MSCI Korea (KOR)0%
- MSCI Taiwan (TWD)0%
DWS factsheets, 30 September 2026. All bars use the same 0 to 40% scale. Equal weight is approximate: about 0.2% per company. Ordered by the figure shown, not a ranking of merit.
The overlapping funds also own different companies. Their shared holdings explain why adding a fund may increase an existing exposure. Equal weight reduces the biggest companies’ influence by giving each company roughly the same share of the fund.
A country fund can also depend heavily on one company: TSMC is 30.2% of the Taiwan fund, while Samsung Electronics is 32.0% of the Korea fund including its non-voting preference shares. Those percentages are from DWS holdings at 30 September 2026. A country label does not mean your money is spread evenly across its companies.
Holdings detail: the biggest companies and why the country funds concentrate.
| Fund | In the same five companies | Biggest company | Ten biggest together |
|---|---|---|---|
| Nasdaq-100 (XND) | 31.7% | Nvidia 8.4% | 47.0% |
| S&P 500 (XUS) | 30.6% | Nvidia 8.3% | 38.8% |
| AI & Big Data (XBG) | 23.9% | Microsoft 5.8% | 45.4% |
| MSCI World (XWR) | 21.7% | Nvidia 5.8% | 27.6% |
| S&P 500 Equal Weight (EUS) | about 1% | Moderna 0.3% | 2.5% |
| Nikkei 225 (JPY) | 0% | Advantest 12.3% | 49.1% |
| MSCI Korea (KOR) | 0% | Samsung Electronics 28.3%, 32.0% with its preference shares | 67.3% |
| MSCI Taiwan (TWD) | 0% | TSMC 30.2% | 61.8% |
DWS factsheets, holdings at 30 September 2026. The equal-weight figure is approximate: each of its 500 companies is about 0.2%. Ordered by the figure shown, not a ranking of merit.
TSMC is 54.0% of the full MSCI Taiwan index (MSCI, September 2026). European rules allow qualifying index-tracking funds to use a 20% issuer limit, rising to 35% for one issuer in exceptional market conditions. The fund therefore tracks a capped version, MSCI Taiwan 20/35. The Nikkei 225 weights companies by share price rather than size, which is how chip-testing firm Advantest becomes its largest holding.
Where does the money go?
Fees taken inside the fund. The Xtrackers S&P 500 fund charges 0.03% a year whether bought in London or on SGX. iFAST ETFs have another layer: 0.25% a year plus running costs to hold a Xtrackers fund. Published total estimates already account for fund expenses; do not add the underlying fee again. They reduce the investment’s value, rather than arriving as a separate platform bill.
Tax on dividends. Dividends are cash paid by companies to their shareholders. For ordinary US share dividends, an eligible Irish fund generally faces 15% US withholding tax. A Singapore-resident individual who is not a US person generally faces 30% on ordinary distributions from a US equity ETF. These percentages apply to dividends, not your whole investment.
Buying and selling costs. Your broker charges a trading fee, called commission. SGX also charges 0.0436% with GST on each trade. The gap between buy and sell prices adds a cost too. For funds priced in another currency, you may also pay to convert money when buying and selling.
iFAST Xtrackers MSCI Korea UCITS Index ETF (SGX: KOR). Annual fee disclosures and arithmetic, not all-in ownership costs. Brokerage, trading and currency friction are not fully captured.
Current-fee build-up
Stated fees · incomplete total0.25% Singapore management
+ 0.45% underlying fund
+ Singapore running expenses
Uses the underlying fund’s stated 0.45% fee. No rebate or subsidy assumed.
per S$10,000
At the fee ceilings
Component limits · not a total cap0.90% Singapore management maximum
+ 0.45% underlying all-in limit
+ Singapore running expenses
The running expenses have no combined ceiling stated in the fee table.
per S$10,000
iFAST’s estimate
Published total · not a guaranteeThe publisher gives a total, but does not provide the breakdown.
This is the figure used in our calculator. Do not add the fees above to it.
per S$10,000
The missing piece: the 0.67% estimate is below the 0.70% fee build-up even before Singapore running expenses. The sources do not explain why. We cannot turn these disclosures into a confirmed total expense ratio or an overall capped total.
What is included, and where the figures come from
Underlying 0.45%: up to 0.25% management + 0.20% fixed fee. These are already inside the 0.45%; do not add them again. The fixed fee belongs to the overseas Xtrackers MSCI Korea UCITS ETF, Class 1C.
Singapore expenses: custodian, registrar and administrator fees may each reach or exceed 0.10%. That is neither a combined estimate nor a cap. The 0.90% maximum replaces the current 0.25% management charge in the ceiling case; it is not added to it.
Basis: simplified fee build-ups assume full investment in the underlying fund and a constant S$10,000 holding. Each fee is charged on its own fund’s assets. These are fund expenses, not a separate iFAST platform bill.
Components: prospectus, registered 29 September 2026, Korea sections 6C–6D; underlying fee: DWS factsheet, 30 September 2026. Total estimate: FSM Global, Table 1, data at 29 September 2026; single publisher source, not audited actual costs.
Fee build-ups: prospectus, 29 September 2026; DWS, 30 September 2026. Publisher estimate: FSM Global, data at 29 September 2026. Linked sources and assumptions above.
Fund fees repeat each year; dealing costs arise when you trade. The calculator keeps these separate.
One fund or two layers: why it matters
The four direct Xtrackers listings have no extra Singapore fund fee. S&P 500, Nasdaq-100, MSCI World and S&P 500 Equal Weight are existing Irish fund share classes listed on SGX. Buying here does not add a second fund. Their stated annual fees range from 0.03% to 0.20%, per DWS factsheets at 30 September 2026.
The four iFAST funds add a Singapore fund that holds an overseas fund. They offer Japan, Korea, Taiwan or AI exposure through a local listing. Their published total fee estimates include both layers; the overseas fund fee is not another charge to add.
Choose the exposure first, then compare ways to buy it. The direct listings have a simpler structure and lower stated annual fees. But a World or US fund cannot replace a deliberate Japan, Korea, Taiwan or AI allocation. Nasdaq-100 is also more concentrated than a broad world fund.
The iFAST structure may be useful when that specific exposure matters and overseas dealing is unavailable, or local account access is valuable. With overseas access, compare the underlying fund directly against its iFAST version. The extra fund layer is one cost to weigh alongside trading charges and convenience.
SGX or overseas: what changes?
Paying in Singapore dollars avoids a separate broker conversion, not all currency costs. Currency-related dealing costs may arise inside funds or in market-makers’ quoted prices. Exchange-rate movements still affect investment value.
Direct Xtrackers listings on SGX: local trading hours and SRS access, subject to your operator. The S&P 500 fund charges 0.03% annually on either exchange. The same share class shares portfolio costs; brokerage and exchange prices can differ.
iFAST listings on SGX: local access through another fund, with expenses at both fund levels. The published TER estimates below cover the fund-expense layers.
Buying overseas: direct ownership avoids the iFAST fund layer where one exists. It requires overseas market access, suitable trading hours and foreign-currency funding. Broker charges vary. These listings cannot be bought with SRS money.
What to compare: fund fees, broker commissions and minimums, account charges, currency terms and live buy/sell prices. Taxes and fund-level trading costs also affect returns. Fees alone cannot identify the better outcome.
Basis: DWS fund fees at 30 September 2026; iFAST structure and access terms in its prospectus registered 29 September 2026. DWS explains that fund performance and exchange prices are affected by transaction costs, taxes, liquidity and trading hours. We do not project an all-in cost or rank the routes.
The iFAST funds: an extra fee for local access
Total expense ratio (TER) covers yearly fund operating expenses. It does not capture every trading cost or tax. iFAST publishes these estimates:
| iFAST ETF | Estimated TER per year | On S$10,000 for one year |
|---|---|---|
| Japan (Nikkei 225) | 0.43% | About S$43 |
| AI & Big Data | 0.63% | About S$63 |
| Korea | 0.67% | About S$67 |
| Taiwan | 0.77% | About S$77 |
Source: FSM Global, iFAST’s platform: Japan and AI, data at 30 September 2026; Korea and Taiwan, data at 29 September 2026. Single-source publisher estimates, not audited actual costs or caps. Amounts assume a constant S$10,000 holding. Brokerage and currency conversion are extra.
We found no overall TER cap in the prospectus. Its 0.90% ceiling covers only Singapore’s management fee, currently 0.25%. Other expenses still apply.
The publisher does not show how the totals fit the prospectus components. The Korea example above shows the gap.
The calculator shows company overlap and annual fund fees for amounts you enter. Its starting mix is illustrative, not a suggested portfolio.
Choose the market first, then the way to buy it. The four direct Xtrackers listings have no extra Singapore fund layer. The four iFAST funds add a fund layer for local access to Japan, Korea, Taiwan or an AI theme. These are different investments, not cheaper and dearer versions of the same portfolio.
Enter what you hold or plan to hold in each fund, in Singapore dollars. Equal amounts are filled in as a hypothetical example, not a suggested portfolio. Leave a fund at 0 to exclude it. For direct listings, the fee covers one fund. For iFAST, the published total expense ratio (TER) estimates cover both fund layers: do not add the overseas fee again. These estimates are not guaranteed caps.
| Fund | Fund fee a year | Amount S$ |
|---|
Published annual fund charges only, not all-in ownership costs. Broker charges, live spreads, taxes and fund-level trading or currency friction are not projected.
DWS fees: 30 September 2026. iFAST publisher TER figures: Japan/AI, 30 September 2026; Korea/Taiwan, 29 September 2026. These pre-launch TERs are estimates, not caps; their component reconciliation is not supplied. Links open in a new tab. Dates identify the figures used here; issuer documents may subsequently be updated. Product highlights may show historical expense ratios or fee ceilings rather than the current factsheet fee.
How this is calculated
What you own. Each company’s share of your total = the sum over your lines of (amount in the line × the company’s weight in that fund) ÷ your total. Weights are the funds’ published top-ten holdings at 30 September 2026 (DWS factsheets); a company outside a fund’s top ten counts as zero there, so true figures can be slightly higher. The equal-weight fund uses its published top-ten weights, plus a 0.2% estimate for other US companies shown. Samsung Electronics includes its preference shares. The combined fee weights each line’s annual fund charge by amount. All four iFAST funds use FSM Global’s published pre-launch TER figures: Japan/AI at 30 September 2026 and Korea/Taiwan at 29 September 2026. These are estimates, not caps.
Fees and access. Annual fee disclosures are shown separately for each legal fund. For iFAST, the published TER is used once; its underlying fund fee is not added again. The ownership view weights disclosed annual fees by your entered amounts. Neither view estimates all-in costs or future returns.
What this is not. Advice or a ranking. Lines and routes stay in a fixed order; the numbers are published holdings and fee disclosures, including labelled publisher estimates.
a theenoughpoint.com toolThe buy and sell prices matter too
A low annual fee does not guarantee a cheap purchase. Delayed Yahoo quotes on 13 October 2026 showed gaps from 0.03% on Nasdaq-100 to 1.46% on equal weight. These were different mid-morning times, from one source, not typical trading costs.
Buying at the higher quoted price costs roughly S$73 more than buying at the midpoint on S$10,000. That is nearly five years of the equal-weight fund’s 0.15% annual fee on a constant holding. The live quote is a separate part of the bill, outside the annual fund fees shown in the calculator.
The day-one quote snapshot: prices, times and trading volumes.
| Line | Time | Buy price | Sell price | Gap | Shares traded |
|---|---|---|---|---|---|
| S&P 500 (XUS) | 09:57 | S$19.57 | S$19.56 | 0.05% | 29,576 |
| Nasdaq-100 (XND) | 10:10 | S$91.82 | S$91.79 | 0.03% | 2,040 |
| MSCI World (XWR) | 10:39 | S$207.00 | S$205.50 | 0.73% | 1,919 |
| S&P 500 Equal Weight (EUS) | 10:34 | S$153.73 | S$151.50 | 1.46% | 612 |
Yahoo Finance delayed quotes, Singapore time, 13 October 2026. Quotes on a new line change by the minute; these are a snapshot, not a measurement of a typical day.
What SGX gives you, and what it does not
- Paying in Singapore dollars, without converting your cash.
- Access with SRS money, subject to your operator enabling the fund.
- Local trading hours and a local broker, with the option of holding shares in your own Central Depository (CDP) account.
- On iFAST’s funds, a one-share trading lot. The initial offer price is S$1; the market price can change after listing.
- A lower fee from the Xtrackers fund itself.
- A guarantee that the buy and sell prices will be close together.
- Protection against moves in the currencies of the assets inside.
- CPF access: none of the eight is on CPF Board’s list of six ETFs.
Paying in Singapore dollars does not remove currency risk. Your investment still owns assets priced in US dollars, yen, won or Taiwan dollars. The currency you pay with does not change what the fund owns.
SRS and CPF also have different rules beyond the investments they permit. The CPF-versus-SRS comparison covers access to the money; the estate-tax explainer covers what can happen when holdings pass to family.
They arrive after the run: what launch research can and cannot tell us.
The funds inside the iFAST ETFs had already risen sharply before the launch. In the year to 30 June 2026, Korea returned +187.5% and Taiwan +102.3%, both in US dollars. Japan’s Nikkei 225 returned +75.2% in yen; AI & Big Data returned +50.2% in US dollars. These are the prospectus figures, in different currencies, not a like-for-like performance ranking.
Research suggests that theme funds often launch when their subject is attracting attention. A 2023 study in the Review of Financial Studies examined US ETFs from 1993 to 2019. Over their first five years, specialised funds underperformed by about 30% after adjusting for risk.
That finding concerns theme funds such as the AI fund, not whole-country index funds. It is a tendency across hundreds of launches, not a forecast for any one fund. Nothing here predicts where these markets go next.
Three questions before buying anything new
- What is the biggest company inside, and do I own it already through another fund? The top ten holdings are on every factsheet, with the date.
- Which fund and broker fees are disclosed, and which costs remain variable or unknown? What is the gap between the buy and sell price today?
- Which money can reach it: cash, SRS or CPF?
The decision comes back to one question: am I adding different investments, or paying another way to own the same companies?
Why four funds came from DWS and four from iFAST
DWS listed the existing Irish funds directly on SGX. It registered them with MAS as recognised schemes, with Flow Traders Asia providing buy and sell quotes. Moomoo distributed them during the subscription window.
iFAST took a different route: a Singapore fund that holds an overseas fund. Its Singapore company, iFAST Global ETFs Select Series VCC, has four funds, each holding one Xtrackers fund. iFAST charges 0.25% a year for managing them. iFAST Financial and North Point Global provide buy and sell quotes.
The Irish and Luxembourg funds inside are, in the prospectus’s words, “not authorised by MAS and will not be directly offered to the public in Singapore”. You buy shares in the Singapore fund instead.
Why use a partner? The history offers a possible explanation, not a confirmed motive. In August 2020, DWS removed 23 Xtrackers listings from SGX, citing “the current level of the Net Asset Value of the Singapore Shares”. These included MSCI Korea 1C and MSCI Taiwan 1C, the versions of the funds that iFAST now holds.
iFAST supplies the Singapore fund and local distribution; DWS manages the underlying fund. The prospectuses establish those roles, but not how the firms divide every commercial cost. iFAST has described issuing ETFs as a “natural extension” of its role, and says the first funds follow its research views. The firms’ commercial terms are not public; this explanation of their motives is inference.
For the investor, the distinction is the fee layers. The direct DWS listings have one fund’s fees. The iFAST listings have the Singapore fund’s expenses and the overseas fund’s expenses. Neither structure is a US fund, so both sit outside the US estate-tax issue described in the earlier article.
Fund details: codes, registration, underlying funds and fees.
A separate platform fee, for unit trusts. A unit trust is another type of investment fund. The platforms cited here charge 0.30%–0.60% a year on top of the unit trust’s own fund fee, depending on the account and service. This is separate from the iFAST ETF expenses discussed here.
| SGX code | Fund | Registered in | Tracks | Fee a year | Underlying Xtrackers class |
|---|---|---|---|---|---|
| XUS | Xtrackers S&P 500 UCITS ETF 4C | Ireland | S&P 500 | 0.03% | itself |
| XND | Xtrackers NASDAQ 100 UCITS ETF 1C | Ireland | Nasdaq-100 | 0.20% | itself |
| XWR | Xtrackers MSCI World UCITS ETF 1C | Ireland | MSCI World | 0.12% | itself |
| EUS | Xtrackers S&P 500 Equal Weight UCITS ETF 1C | Ireland | S&P 500 Equal Weight | 0.15% | itself |
| XBG | iFAST Xtrackers Artificial Intelligence & Big Data UCITS Index ETF | Singapore | Nasdaq Global AI and Big Data | Published estimated TER: 0.63%; fee basis in Method | Xtrackers AI & Big Data 1C, Ireland |
| JPY | iFAST Xtrackers Nikkei 225 UCITS Index ETF | Singapore | Nikkei 225 | Published estimated TER: 0.43%; fee basis in Method | Xtrackers Nikkei 225 1C, Luxembourg |
| KOR | iFAST Xtrackers MSCI Korea UCITS Index ETF | Singapore | MSCI Korea 20/35 | Published estimated TER: 0.67%; fee basis in Method | Xtrackers MSCI Korea 1C, Luxembourg |
| TWD | iFAST Xtrackers MSCI Taiwan UCITS Index ETF | Singapore | MSCI Taiwan 20/35 | Published estimated TER: 0.77%; fee basis in Method | Xtrackers MSCI Taiwan 1C, Luxembourg |
- All eight accumulate: dividends are reinvested, not paid out. None is currency-hedged.
- iFAST lines: offer at S$1.00 a share from 1 October to 12:00 on 14 October 2026; listing 22 October 2026; board lot one share. “Costs” means other fees that the prospectus says may each amount to or exceed 0.10% a year; audited actual expense ratios are not yet available. All four iFAST totals use FSM Global’s published pre-launch figures, treated here as estimates rather than audited actual costs. The combined Singapore running expenses are not stated.
- DWS lines: same ISIN as the London and Frankfurt listings; listing 13 October 2026.
Method: how each figure was computed.
- Five-company share = the sum of the fund’s published weights in Nvidia, Apple, Microsoft, Amazon and Alphabet (both share classes added), from each fund’s top-ten holdings at 30 September 2026. All five are in the top ten of each of the four US-heavy funds, so the figure is exact for those funds. For the equal-weight fund, which holds about 500 companies at roughly 0.2% each, the figure is five times 0.2%, approximate.
- Biggest company and ten biggest together are the issuer’s published top-ten figures at the same date, summed.
- iFAST costs: the tool and reproduction script use FSM Global’s published TER figures: Japan 0.43% and AI 0.63% (data at 30 September 2026), Korea 0.67% and Taiwan 0.77% (data at 29 September 2026). These pre-launch figures are treated as single-source estimates, not audited actual charges or contractual caps. They are entered as totals; the underlying fund fee is not added again. The source does not provide a component reconciliation, so no rebate or subsidy is assumed.
- Prospectus components: Korea lists 0.25% current Singapore management, other Singapore expenses, and an underlying all-in fee of up to 0.45%. Taiwan lists the same Singapore management fee and an underlying all-in fee of up to 0.65%. Korea’s underlying up-to-0.45% includes up-to-0.25% management and a 0.20% fixed fee. That fixed fee belongs to the underlying fund. The 0.90% Singapore management maximum is not an overall TER cap; we found no overall cap in the prospectus.
- Japan and AI components: the prospectus lists current Singapore management of 0.25%, other Singapore expenses, and underlying all-in fees of up to 0.09% for Japan and up to 0.35% for AI. FSM Global explicitly calls Japan’s TER an estimate; its AI table says “Total Expense Ratio”. As both funds are pre-launch, we treat both figures as estimates, not historical audited ratios. Neither source supplies a component reconciliation.
- Day-one gap = (buy − sell) ÷ midpoint. S$73 is approximately half the 1.46% gap on S$10,000, measured against the quote midpoint, not a separate fee or a fair-value estimate.
- Menu counts: SGX’s categories (Singapore 7 + 7, China 13 + 2, regional and global 16 + 8 = 53), plus eight.
- Every computed figure is reproduced by the script behind this piece.
Sources and verification: primary where it matters, checked 13 October 2026.
- SGX market figures, categories and SRS statement: SGX, ETF Market Highlights 1H2026 (July 2026, data June 2026): 53 ETFs and L&I products, S$20.5 billion, retail 42%, “All SGX listed ETFs are SRS-eligible”, the category lists. A public SGX publication, distributed as a PDF.
- Published Japan and AI TER figures: FSM Global’s Japan article and AI & Big Data article, Table 1 in each, data at 30 September 2026: 0.43% and 0.63% respectively. Japan is explicitly described as estimated; AI is labelled TER, but no audited history is available before launch. Both are treated as estimates here. Same publisher and commercial interest as the Korea/Taiwan source; no independent corroboration or component reconciliation.
- Published Korea and Taiwan TER estimates: FSM Global, Korea and Taiwan arrive on SGX, Table 1, data at 29 September 2026: 0.67% and 0.77% a year respectively. This is iFAST’s own platform, a single commercially interested source; the estimates are not independently corroborated. No component breakdown or overall TER cap is given.
- iFAST structure, fees, dates, codes, SRS and CPF: iFAST Global ETFs Select Series VCC, amended prospectus registered 29 September 2026: feeder structure, Class 1C of each underlying, management fee 0.25% (maximum 0.90%), other fees “may each amount to or exceed 0.10%”, underlying all-in fees, listing 22 October 2026, offer S$1.00, “paid for with cash or SRS monies”, “currently not included under the CPF Investment Scheme”, market makers North Point Global and iFAST Financial, SGX clearing fee 0.0325% and access fee 0.0075%, and the underlying funds’ one-year returns to 30 June 2026.
- Fund costs, currency and exchange prices: DWS ETF FAQ, sections on tracking error, trading price and currency exposure, read 13 October 2026. TER alone does not describe every cost affecting fund returns; trading prices also depend on liquidity and market hours.
- DWS lines: the Singapore prospectus registered by MAS on 14 September 2026, as cited in the earlier piece.
- Holdings and fund fees at 30 September 2026: DWS factsheets for the eight Xtrackers classes (S&P 500 4C, Nasdaq 100 1C, MSCI World 1C, S&P 500 Equal Weight 1C, AI & Big Data 1C, Nikkei 225 1C, MSCI Korea 1C, MSCI Taiwan 1C).
- TSMC’s weight in the full index: MSCI Taiwan Leaders 50 Select Index factsheet, parent index column, 54.00%, data to September 2026.
- The 20% and 35% limits: Directive 2009/65/EC (UCITS), Article 53. Nikkei 225 weighting by share price: Nikkei Inc., index profile.
- The 2020 delisting: SGXNet notice of 29 June 2020: 23 share classes delisted with effect from 21 August 2020, including MSCI Korea 1C (LU0292100046) and MSCI Taiwan 1C (LU0292109187).
- CPF: CPF Board, List A of included ETFs (updated 17 September 2025): six funds.
- Dividend tax rates: IRS Tax Treaty Table 1 and Publication 515.
- Platform fees: FSM Global pricing, 0.0875% a quarter on equity funds held with cash or SRS, no sales charge; Endowus pricing, 0.60% a year on cash below S$200,000 and 0.30% on a single fund with SRS.
- Specialised fund launches: Ben-David, Franzoni, Kim and Moussawi, “Competition for Attention in the ETF Space”, Review of Financial Studies 36(3), 2023, 987–1042.
- iFAST’s stated reasons: The Edge Singapore, 1 October 2026, “iFAST and Xtrackers by DWS launch four ETFs on SGX”.
- Day-one quotes: Yahoo Finance delayed quotes for XUS.SI, XND.SI, XWR.SI and EUS.SI at the times shown, 13 October 2026.
Soft spots: what we could not confirm.
- The iFAST fees. All four iFAST funds use published pre-launch TER figures, treated as estimates rather than audited actual costs. We could not reconcile them to the prospectus component tables or verify an overall TER cap. We do not infer rebates, subsidies or a fixed Singapore-layer cost from the published totals.
- The menu count. The illustrative 61 is 53 at June 2026 plus eight. Any listing or delisting between July and October 2026 would change it. We have not verified a complete October count.
- Earlier listings. The 2020 delisting notice and June 2026 list do not establish every listing or removal in between.
- Trading and currency costs: broker terms and live quotes vary. Internal fund costs and market-making friction are not measured here; no all-in route cost or break-even period is projected.
- Day-one quotes are delayed and from one source. First prints can be unrepresentative; they are not used to forecast future trading costs.
- SRS on day one depends on each SRS operator and broker enabling the counters.
General information and education only: this is not financial, tax or legal advice, and it takes no account of your objectives, situation or needs. Figures are computed from the sources above; verify the current position before relying on them.